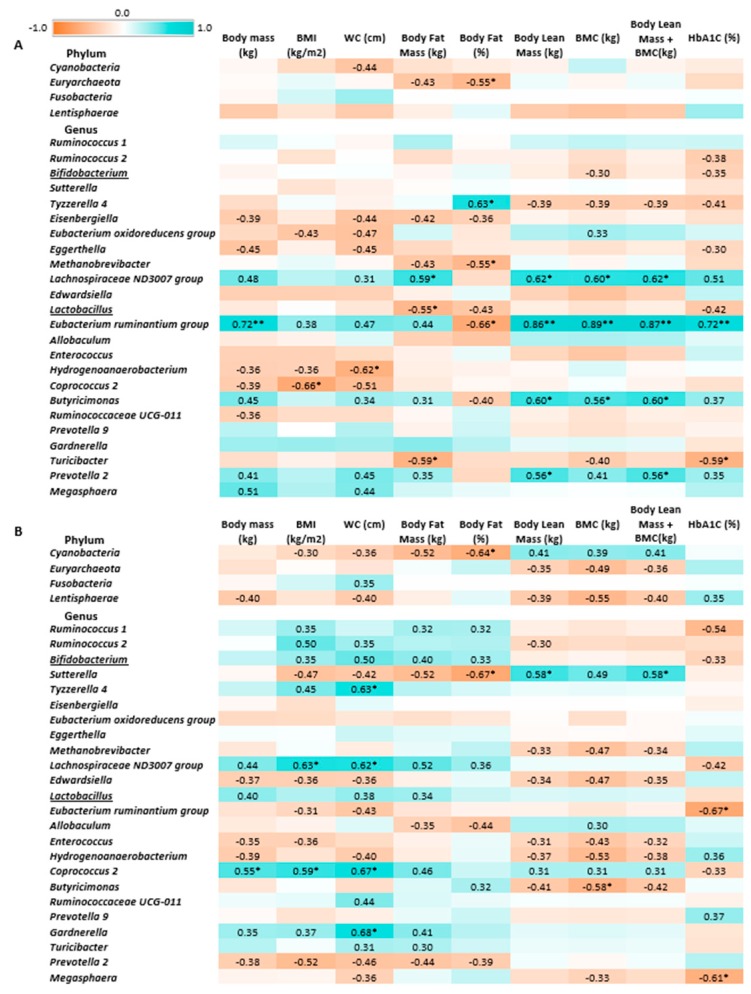
Figure 5.
Heatmap of associations between gut microbiota, body composition and metabolic parameters in the placebo (A) and synbiotic groups (B) at the end of trial. r values were calculated using Pearson’s linear correlation test; * p < 0.05, ** p < 0.01. Pearson’s r values below 0.30 or above −0.30 are not indicated. Red-brown color indicates negative correlation, blue-green color—positive correlation.

