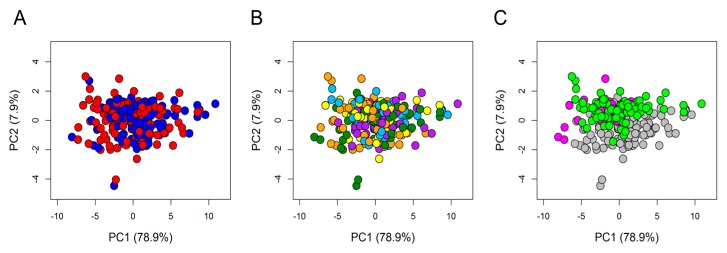
Figure 2.
Principal component analysis (PCA) score plot. PC1 and PC2 account for 79.9% and 7.9%, respectively, of the total variance. In the score plot, each dot represents a different serum sample, and each colour represents a different group: (A) Blue dots = T0 samples; red dots = T1 samples. (B) Dark green dots = anthocyanins (AC); cyan dots = oat beta-glucan (OBG); orange dots = docosahexaenoic acid (DHA); yellow dots = DHA + AC; purple dots = DHA + OBG. (C) grey dots = samples from Germany; magenta dots = samples from the UK; light green dots = samples from France.

