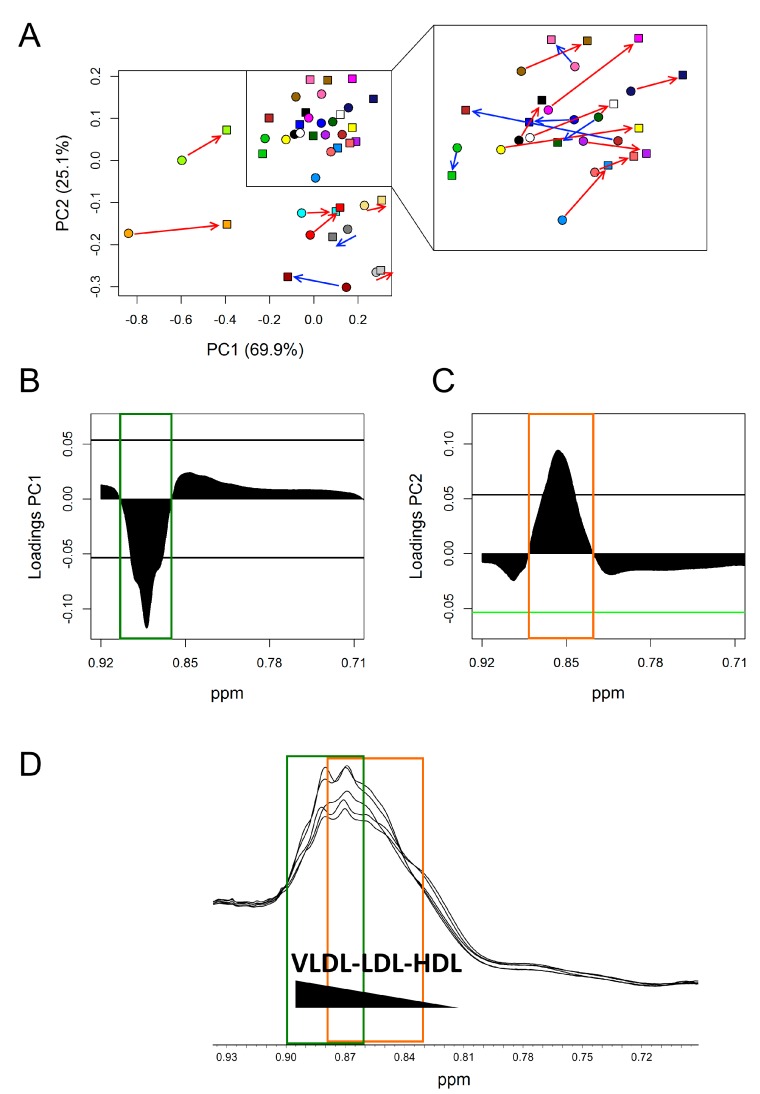
Figure 4.
PCA analysis of lipoprotein methyl group signal (CH3) (0.92–0.71 ppm) of DHA + OBG group. (A) Score plots; each colour represents a different subject at TO (dots) and T1 (squares). Red arrows: Subjects (15 out of 22) that, going from T0 to T1, move towards more positive value along both PC1 and PC2; blue arrows: Subject that moves towards more negative value along PC1. (B) PC1 loading plot. (C) PC2 loading plot. In both loading plots, the threshold (black horizontal lines) used to select significant parts of the methyl signal was calculated considering the spectral area with values beyond two standard deviations of their averages. (D) 1H-NOESY spectral area containing lipoprotein methyl signal. Green square: Significant spectral area in PC1 loading plot; orange square significant spectral area in PC2 loading plot.

