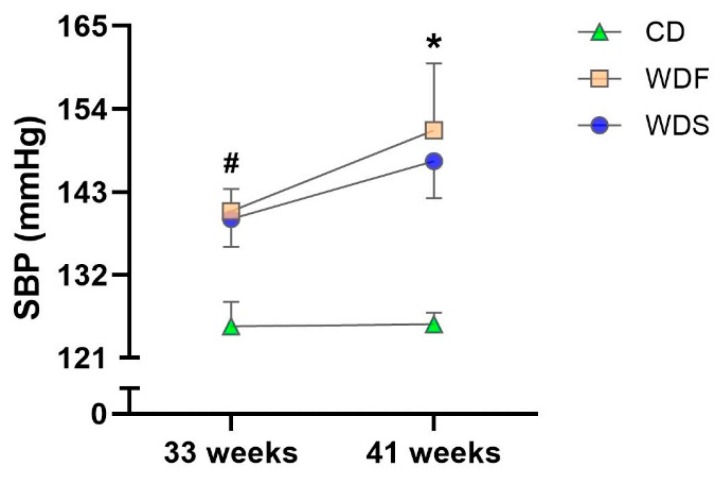
Figure 4.
Systolic blood pressure (SBP) at 33rd and 41st week of dietary intervention with Control diet (CD), Western diet fat (WDF), and Western diet sugar (WDS). Data are presented as mean ± s.e.m. Two-way repeated-measures ANOVA and Bonferroni’s multiple comparisons test. * p < 0.05 Control vs. WDF and WDS; # p < 0.05 Control vs. WDF (n = 7–10 rats per group).

