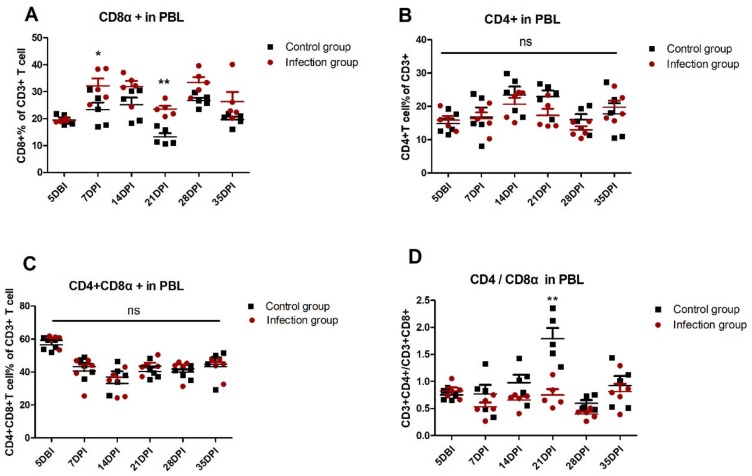
Figure 2.
Dynamic detection of T lymphocyte percentage in peripheral blood lymphocytes (PBL). Five days before infection (DBI) and each week after infection, PBL derived from five chickens of infected and control groups were isolated to detect the T lymphocyte percentage, including the percentage of (A) the CD3+CD8+ T cell, (B) CD3+CD4+ T cell, and (C) CD3+CD4+CD8+. (D) The ratio of CD3+CD4+/CD3+CD8+ was detected. Each sample collected 1 × 10⁵ cells for flow cytometric analysis. The two-way ANOVA was used for statistical comparison. ns p > 0.05, * p < 0.05, ** p < 0.01.

