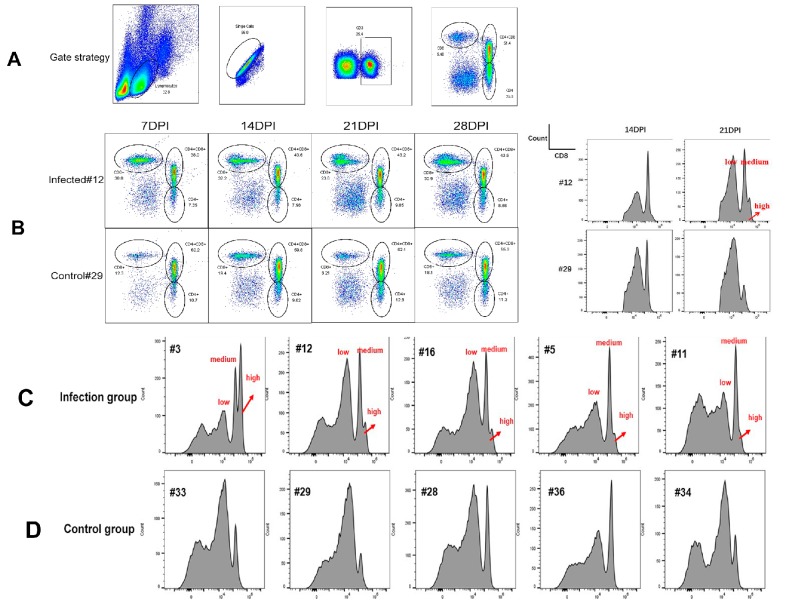
Figure 6.
T cell phenotype analysis. (A) Gating of CD8α+, CD4+, and CD4+CD8α+ T cells with the CD3+(APC), CD4+(FITC), and CD8α+(PE) antibodies. (B) Analysis of the percentage and phenotype of T cells in PBL of ALV-J infected chicken number 12 and control chicken number 29 at various time points. Histogram of the CD3+CD8α+ T cells in PBL of (C) ALV-J infected group and (D) control group at 21 DPI. Each sample collected 1 × 10⁵ cells for flow cytometric analysis.

