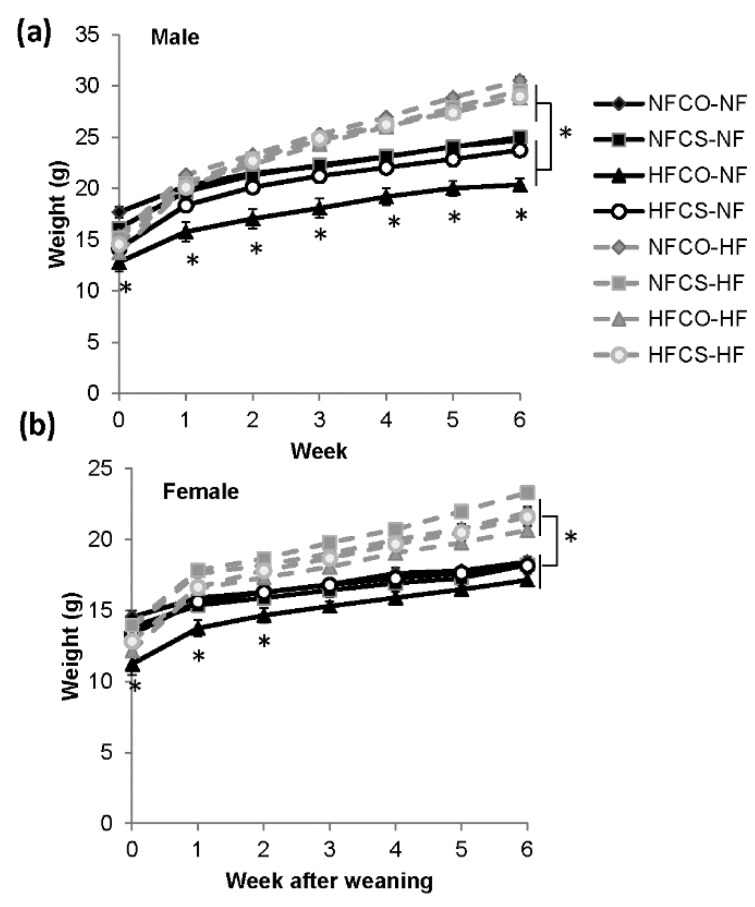
Figure 3.
Mouse offspring weight during the 6-week post-weaning feeding. (a) Represents males and (b) represents females. Grey and dashed lines: post-weaning NF feeding groups, black and solid lines: post-weaning HF feeding groups. n = 12 for the postnatal NF groups and n = 16–20 for the postnatal HF groups for each sex. Data were analyzed using the general linear model. Values represent means ± SEM. *, p < 0.05; NF: normal fat; HF: high fat; CO: untreated control without choline; CS: choline supplemented.

