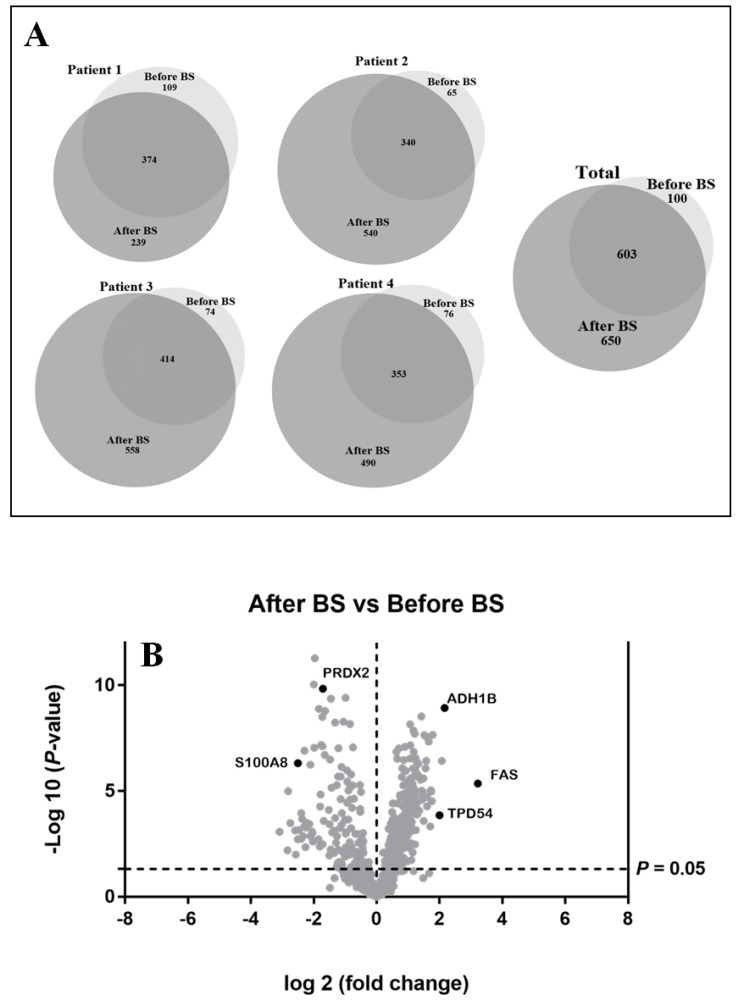
Figure 1.
(A). Effect of obesity and bariatric surgery on protein expression in abdominal subcutaneous adipose tissue depot (aSAT). Venn diagrams showing the qualitative proteomic analysis of aSAT from four obese patients before bariatric surgery (before BS) and the same patients after body weight loss induced by bariatric surgery (after BS). They show the number of unique and overlapping proteins identified individually for each patient before and after bariatric surgery (Patient 1–4), as well as the total of proteins identified. (B). Graphical representation of quantitative proteomics data. Proteins are ranked in a volcano plot according to their statistical p-value (y-axis) and their relative abundance ratio (log2-fold change) between aSAT samples after BS and before BS (x-axis). Off-centered spots are those that vary the most between both groups. The cut-offs for significant changes are fold-changes of 1.5 and p < 0.05.

