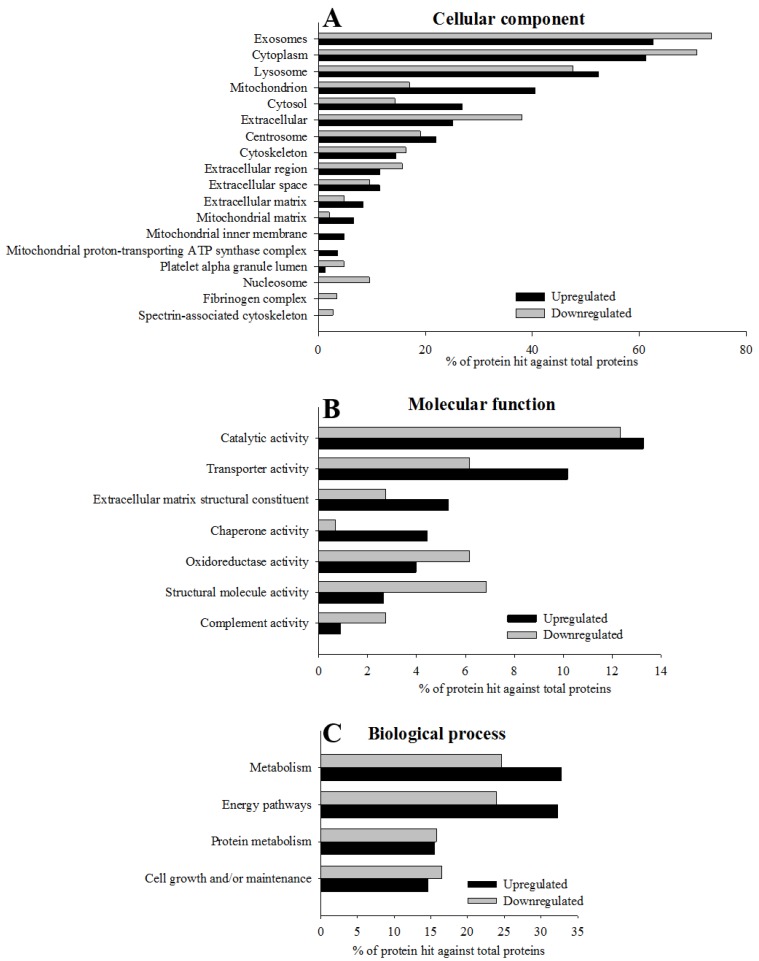
Figure 3.
Gene ontology (GO) enrichment of 364 significantly regulated proteins according to the FunRich functional annotation. The histograms show for each GO term, cellular component (A; p < 10−5), biological process (B; p < 0.05) and molecular function (C; p < 0.05), the most significantly enriched categories of up-regulated and down-regulated proteins quantified using the SWATH-MS approach. Extended data of GO enrichment analysis is provided in Table S3.

