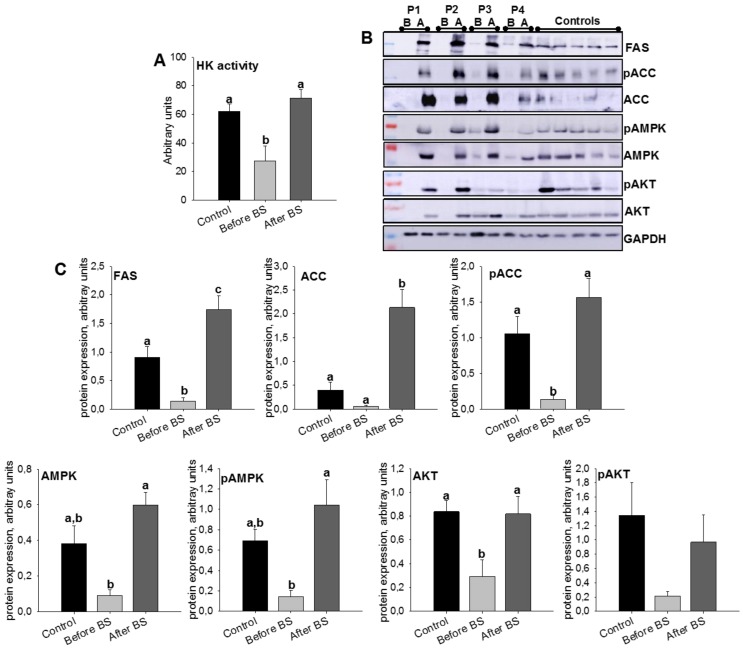
Figure 4.
aSAT hexokinase (HK) activity levels (A) and protein expression levels (B,C) of lipid metabolism and insulin signaling-related enzymes, in control patients and obese patients before BS and the same patients after BS. Values are means ± SEM of six patients per group (HK activity) or 4–5 patients per group (Western blot). Different letters above the bars indicate statistically significant differences, p < 0.05. P.1–P.4 = Patient 1–Patient 4. B = before bariatric surgery, A = after bariatric surgery. Controls = healthy patients with normal BMI. BS = bariatric surgery.

