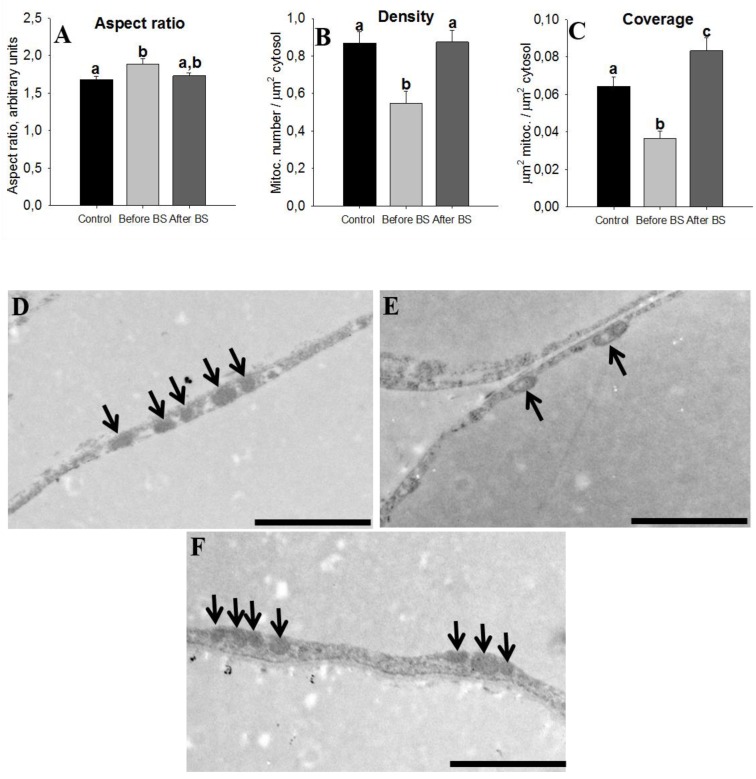
Figure 6.
Mitochondrial morphometrics. Characterization of mitochondrial parameters in aSAT of control patients (healthy patients with normal BMI, n = 5), obese patients before bariatric surgery (before BS, n = 4), and obese patients after bariatric surgery and body weight normalization (after BS, n = 5). Values are means ± SEM. Different letters above the bars indicate statistically significant differences, p < 0.05. The aspect ratio is a measure of mitochondrial length (major axis/minor axis) (A), mitochondria density (B) and coverage (C) were calculated by dividing the number and total area of mitochondria to the cytoplasm area, respectively. Representative electron microscopy images of aSAT sections from control patients (D), obese patients before bariatric surgery (E) and obese patients after bariatric surgery (F), respectively. Bars = 2 µm. The arrows point to the mitochondria.

