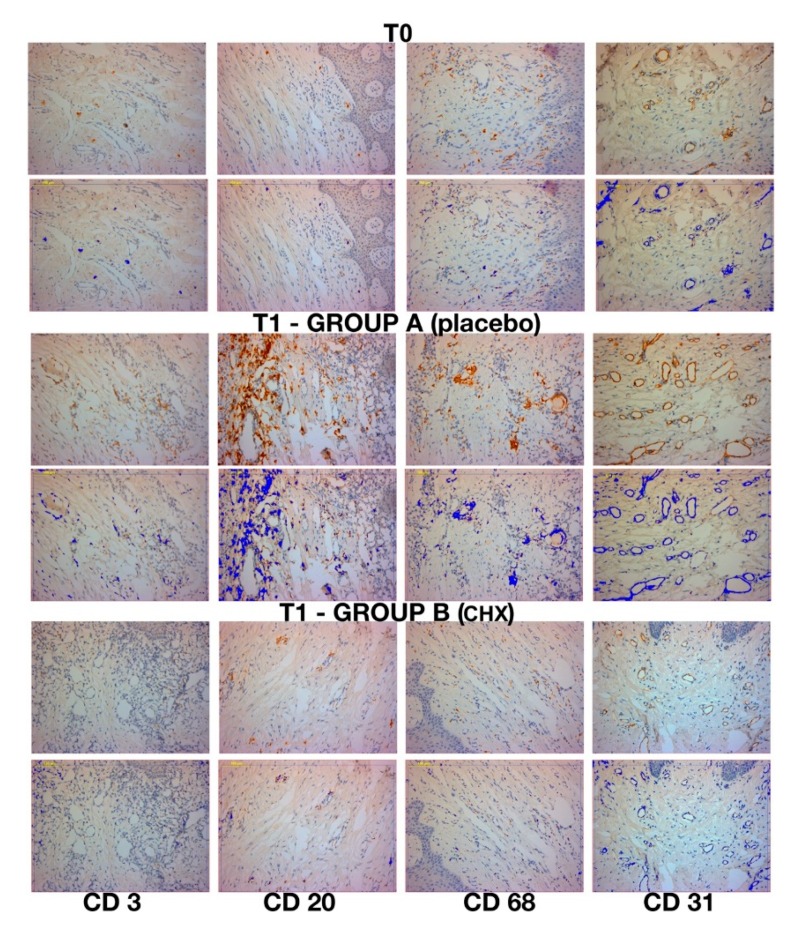
Figure 6.
Immunohistochemical expression at T0, and T1 in group A and B (second surgical stage). Each of these images are in duplicates as one represent the immunohistochemical stain (strep-ABC 20× magnification) meanwhile the duplicate represents the image software analysis (and software analysis 20× magnification). In the first column CD3 expression (strep-ABC 20× magnification and software analysis 20× magnification). In the second column CD20 expression (strep-ABC 20× magnification and software analysis 20× magnification) are shown. In the third column CD68 expression (strep-ABC 20× magnification and software analysis 20× magnification) are shown. In the fourth column CD31 expression (strep-ABC 20× magnification and software analysis 20× magnification).

