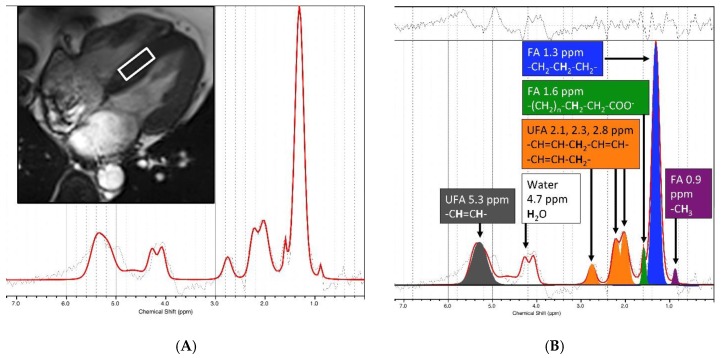
Figure 2.
Example myocardial CMR spectroscopy. (A) A 2 × 2 × 1 cm3 spectroscopic volume (white box) was acquired from the interventricular septum during the systolic phase to generate an input spectrum. (B) 1H-CMR spectra were fitted and analyzed using the LCModel 6.2 software package (right). We quantified the components of myocardial triglyceride resonances, i.e., fatty acids (FA, lipid resonances δ 0.9, 1.3, and 1.6 ppm) and unsaturated fatty acids (UFA, lipid resonance δ 2.1 and 2.3, 2.8, 5.3 ppm).

