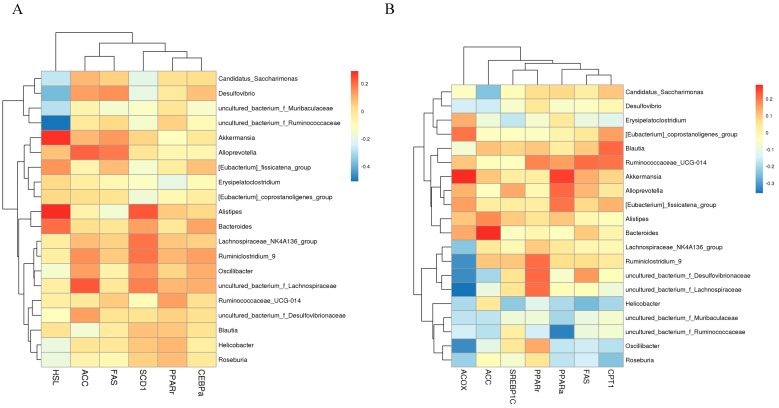
Figure 5.
Spearman’s correlation between the metabolic genes and the relative abundance top 20 bacteria at the genus level (A) metabolic genes in the adipose tissue; (B) metabolic genes in liver tissue. The different colors of bar represented the degree of association (red, positive correlation; blue, negative correlation).

