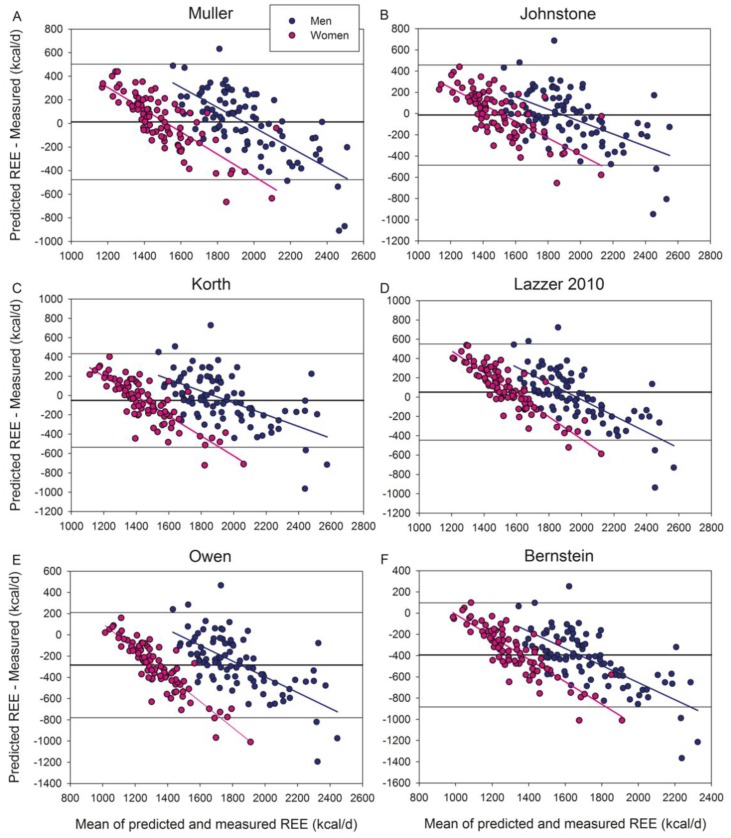
Figure 4.
Bland–Altman plots displaying the agreement between measured and predicted REE by the body composition-based equations of (A) Muller, (B) Johnstone, (C) Korth, (D) Lazzer 2010, (E) Owen, and (F) Bernstein. All these equations included obese subjects in their populations. The thick continuous line indicates the mean value of the differences between predicted and measured REE (bias). The thin lines delimit the 95% confidence interval. All the regression lines were statistically significant at p < 0.001, indicating a systematic bias. Note that “Y” and “X” axes have different scales.

