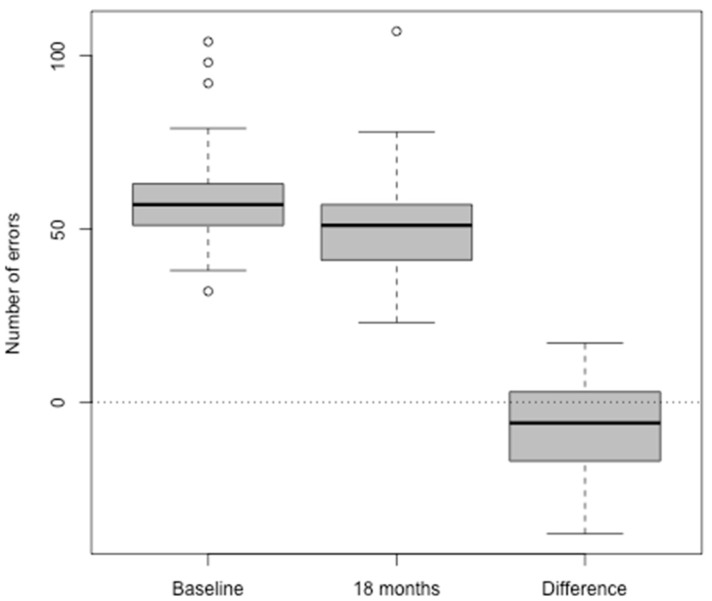
Figure 1.
Executive function (GML) raw scores at baseline and 18 month assessments and their pairwise differences. The Y axis shows the number of errors in responses. The X axis shows assessment points and the difference in scores between the baseline and 18 month post-hearing aid fitting assessments. The boxes represent the observations between the first and third quartile. The hollow circles represent outliers. The bolded lines in the boxes represent the medians.

