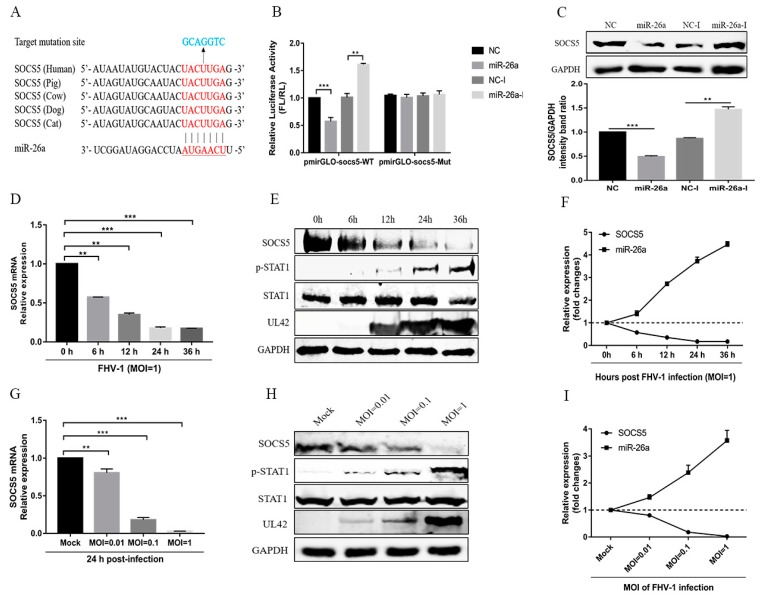
Figure 4.
SOCS5 is a target gene of miR-26a. (A) Diagram of the predicted target sites of miR-26a in the 3′ UTR of SOCS5. The target sites of SOCS5 are indicated with red font, the mutant target sites of SOCS5 are indicated with blue font, and the seed regions of miR-26a are underlined. (B) Verification of target of miR-26a via the dual-luciferase assay. pmiRGLO-SOCS5-26a wild-type or mutant luciferase reporter plasmids were transfected into F81 cells, together with 80 nM miR-26a mimics or 160 nM miR-26a inhibitors. Thirty-six hours post-transfection, relative luciferase activities were tested and calculated by normalizing firefly luciferase activities to Renilla luciferase activities (FL/RL). (C) Verification of target of miR-26a via western blot. F81 cells were transfected with miR-26a mimics (80 nM) or inhibitors (160 nM). Forty-eight hours post-transfection, the cells were lysed for western blot analysis to test the expression of endogenous SOCS5. GAPDH served as an internal control. NC mimics and NC-I served as negative controls. (D–F) F81 cells were inoculated with FHV-1 at an MOI of 1, and then the mRNA (D) or protein (E) levels of SOCS5 as well as the level of p-STAT1 were analyzed by qRT-PCR or WB at the indicated time points (6, 12, 24, 36 h), respectively. The kinetic expression profile of SOCS5 and miR-26a with FHV-1 infection at different time points are shown in (F). (G–I) F81 cells were inoculated with FHV-1 at different MOIs (0.01, 0.1, 1), and the mRNA (G) or protein (H) levels of SOCS5, as well as the level of p-STAT1, were analysed by qRT-PCR or WB at 24 hpi, respectively. The kinetic expression profile of SOCS5 and miR-26a with FHV-1 infection at different MOIs are shown in (I). All samples were independently repeated three times, and data are representative of three independent experiments. The significant differences are indicated as follows: NS > 0.05, ** p < 0.01, *** p < 0.001.

