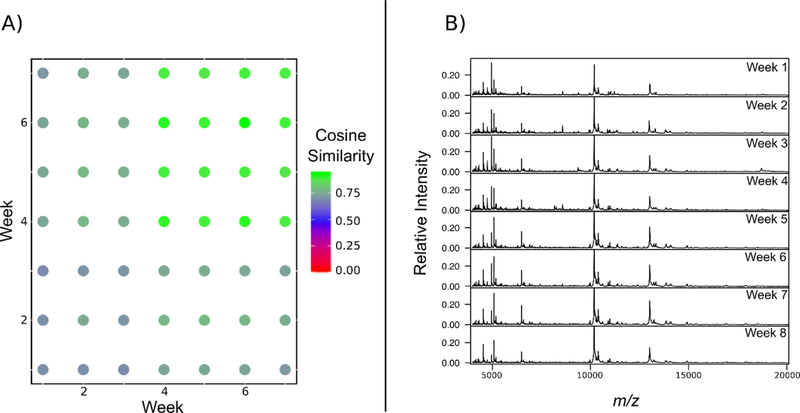
Figure 3.
(A) Dot matrix plot comparing spectral similarity between time points. High cosine scores (green) indicates that the global profiles are highly similar between intersecting time point (i.e. weeks six and seven) while low cosine scores (red) indicates less similarity in features between the spectra of the respective time points. (B) Consensus spectra of vaginal lavages from all mice (N=5) throughout tumor progression for a total of eight weeks (n=24 for each mouse at each time point).

