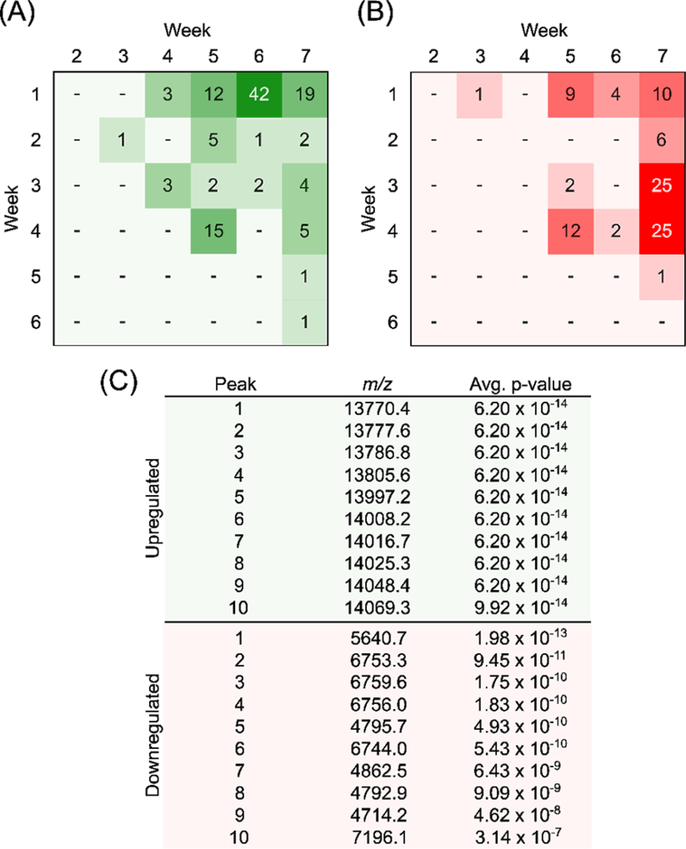
Figure 4.
(A) Pivot table showing number of significantly upregulated signals observed across time points across all five mice. (B) Pivot table showing number of significantly downregulated signals observed across time points across all five mice. (C) Top ten m/z values according to average p-values when comparing weeks one and seven.

