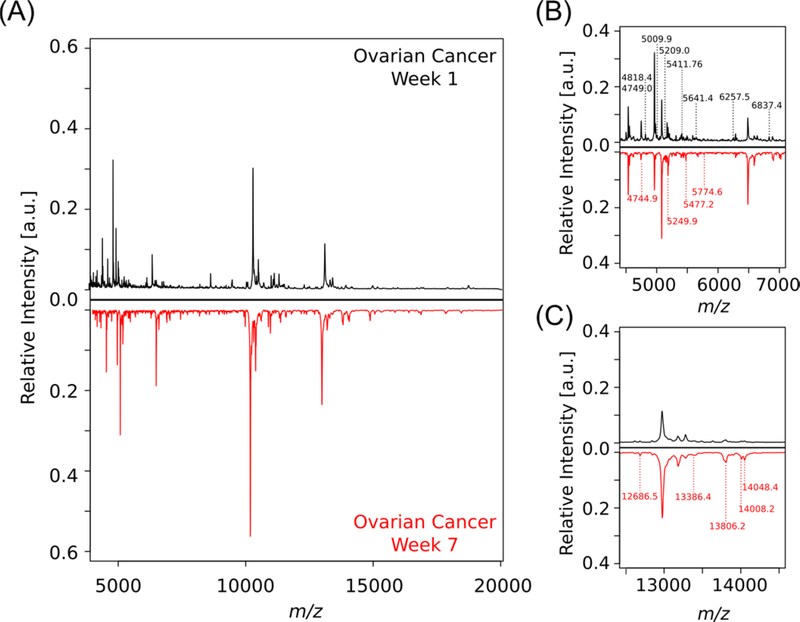
Figure 5.
Mirror plot of average protein fingerprints of murine lavages comparing weeks one and seven in the ovarian cancer murine model (N=5, n=24). (A) Full spectra (m/z 4,000–20,000) mirror plot. In regions with significant differences peaks have been labelled in B and C. Peaks with no significant differences have been left unlabelled. (B) Spectral features are in this region (m/z 4,500–7,000) differ in terms of peaks and intensity with between time points peaks labelled in week 1 are those that are downregulated overtime, whereas peaks shown in week 7 have been upregulated overtime. (C) Spectral features in this region (m/z 12,500–14,500) present a second mass region in which labeled peaks are indicative of those unique to a specific time point which have been upregulated overtime.

