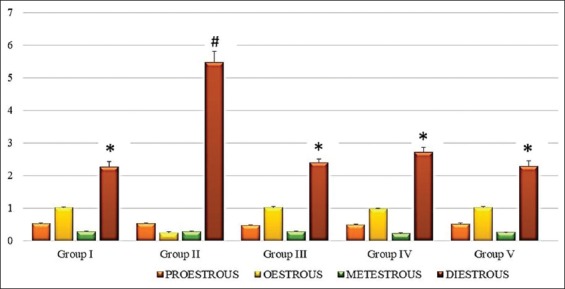
Figure-2.

Graph showing average length of each phase estrous cycle (days) in different groups. Values are mean±standard error (n=6). Means with similar symbols do not differ significantly. Group I: Normal control group; Group II: Cyclophosphamide-induced control group; Group III: Alpha-lipoic acid-treated group; Group IV: Omega-3 fatty acids treated group; Group V: Alpha-lipoic acid+omega-3 fatty acids treated group.
