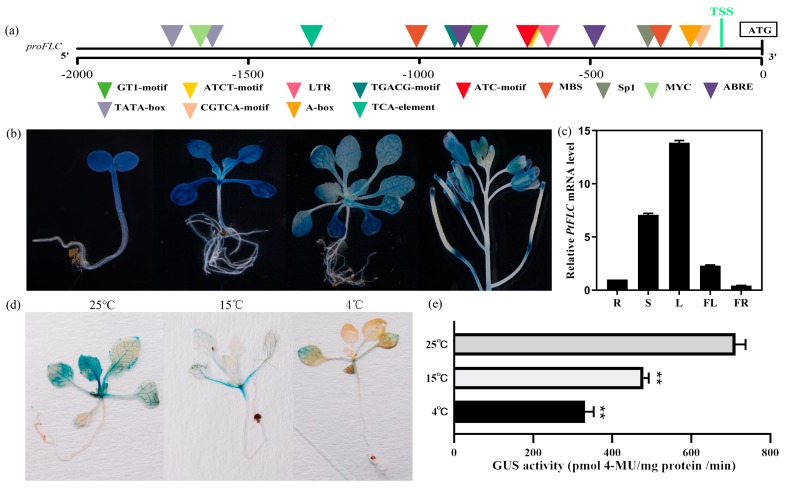
Figure 2.
Promoter activity and spatial expression of PtFLC. (a) Schematic diagram of predicted cis-elements in proPtFLC. (b) Histochemical β-glucuronidase (GUS) staining of proPtFLC in different tissues of transgenic Arabidopsis under long-day conditions. (c) Relative expression of PtFLC in different tissues of trifoliate orange. R, roots; S, stems; L, leaves; FL, flowers at anthesis; FR, whole fruits at 30 days after flowering. (d) Analysis of GUS activity from proPtFLC in transgenic Arabidopsis by different temperature treatments (4, 15, and 25 °C) under long-day conditions. (e) Relative GUS intensity from proPtFLC in transgenic Arabidopsis by different temperature treatments (4, 15, and 25 °C) under long-day conditions. Asterisks indicate significant differences (Student’s t-test): ** P < 0.01.

