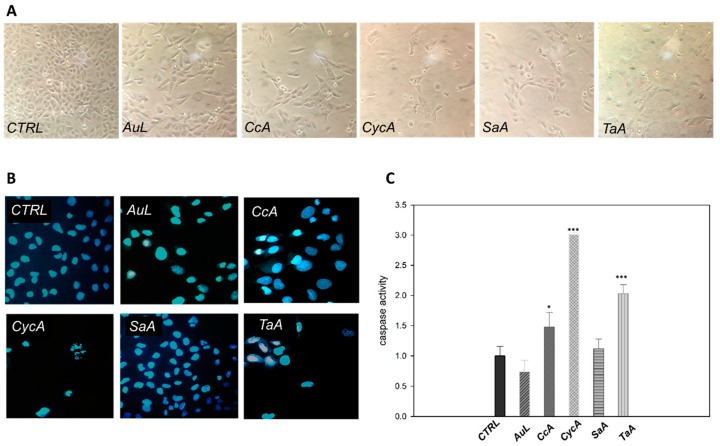
Figure 3.
Apoptotic effects on U2OS cells treated for 48 h with the selected extracts: morphological changes and caspase activity. (A) Images acquired by optical microscope. (B) Images acquired by fluorescence microscope after HOECHST staining. (All the images were taken at the same magnification and depict microscopic fields representative of the whole cell population.) (C) Caspase activity assay (fold change of protein activity was calculated by taking untreated cells as a control = 1). Bar graphs represent means ± SD determined from at least three independent experiments. Differences were considered significant when p ≤ 0.05 (* p ≤ 0.05; *** p ≤ 0.001).

