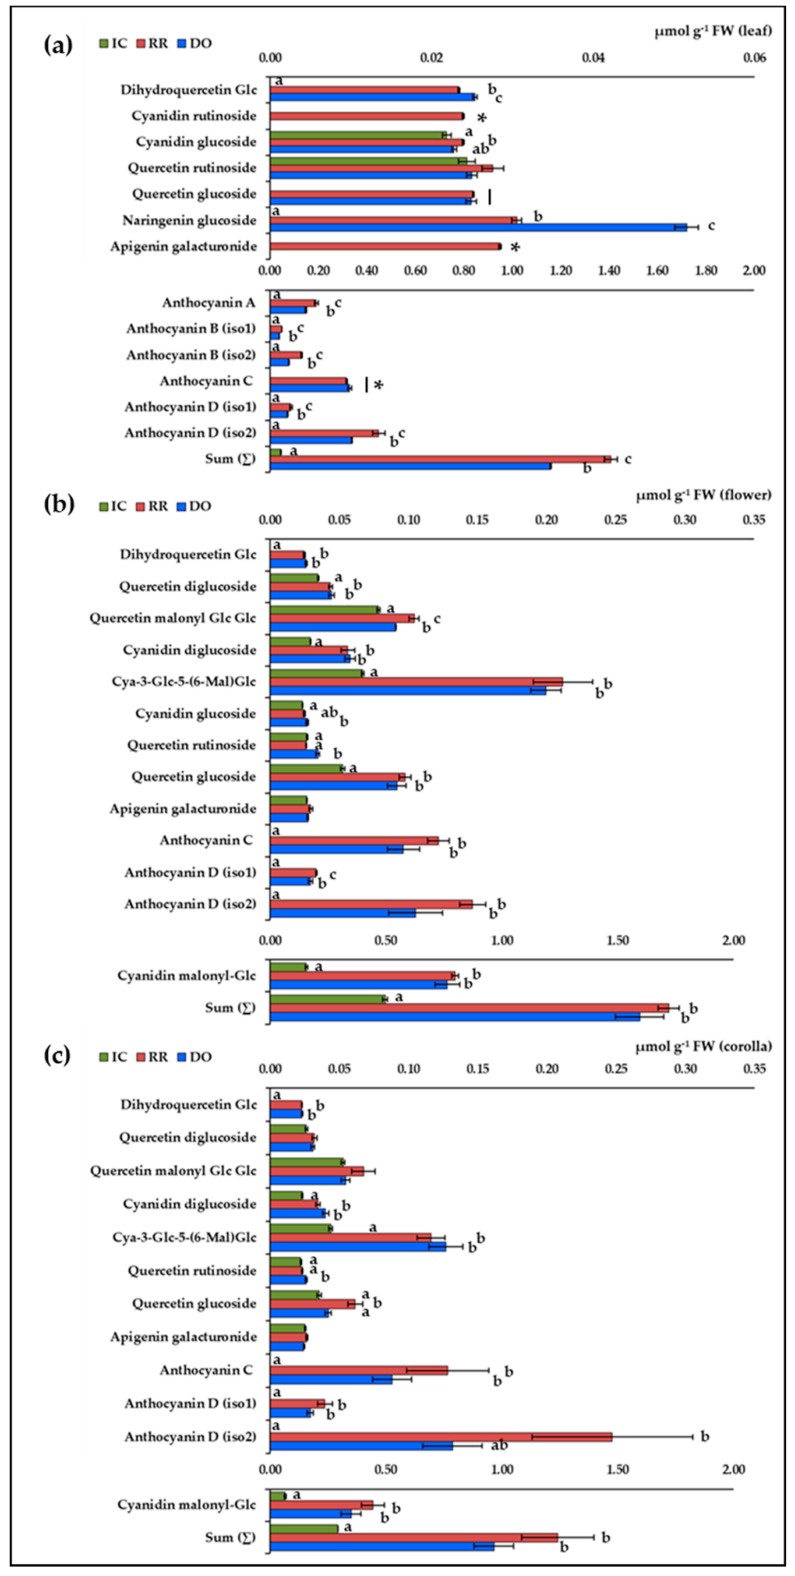
Figure 3.
Contents of flavonoids in green and purple basil. (a) leaf; (b) flower; (c) corolla. Values are the means ± SE (error bars; n = 3) expressed as µmol g−1 FW. Data are grouped in two scales to visualize differences. Significant differences were assessed by one-way ANOVA test (p ≤ 0.05, Tukey post hoc); (*) significant difference respect to zero assessed by one-Sample t-test (p ≤ 0.05).

