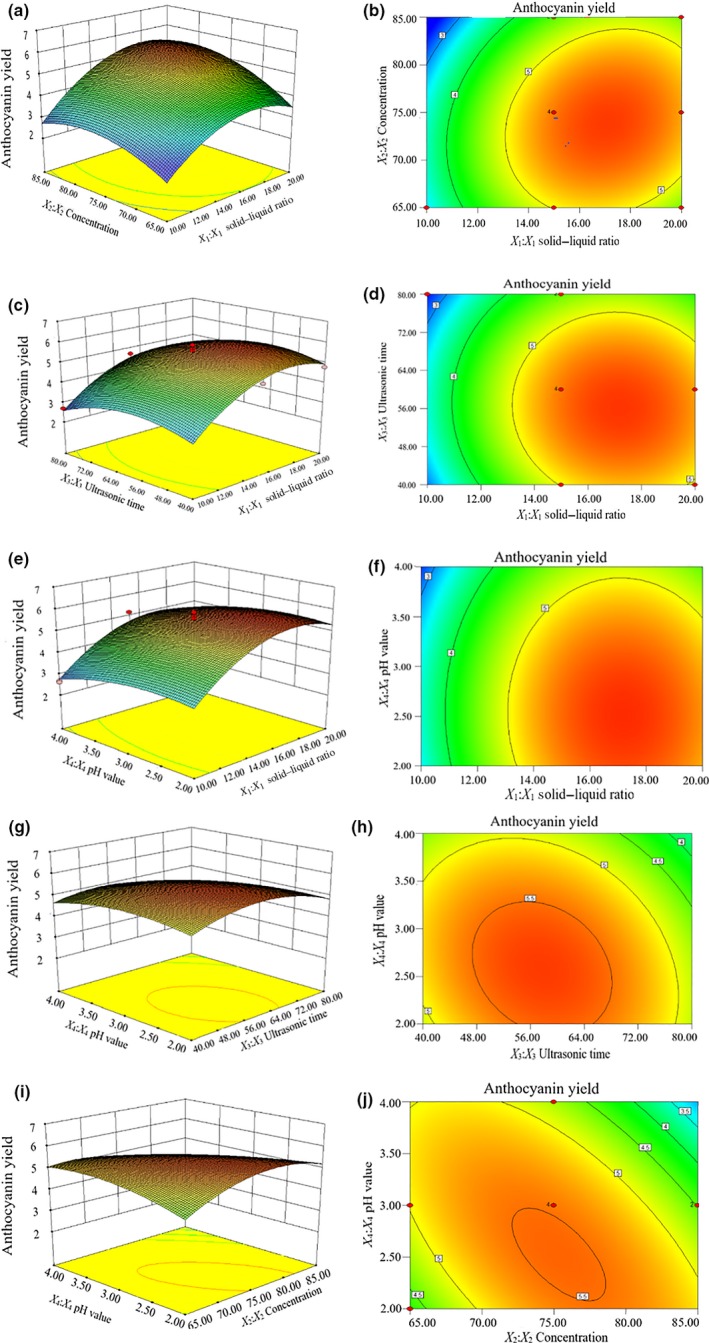
Figure 6.

Response surface and contour plots for the effects of the interactions of the solid–liquid ratio and ethanol concentration (a and b), solid–liquid ratio and ultrasonic time (c and d), solid–liquid ratio and pH (e and f), ultrasonic time and pH (g and h), and pH and ethanol concentration (i and j) on the yield of anthocyanin from red rice bran
