
Figure 3.
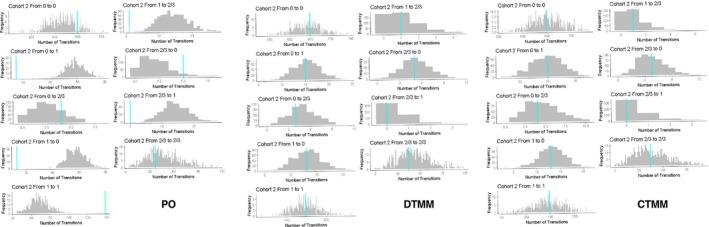
Posterior predictive check for total number of transitions in each transition scenarios in cohort 2 based on the weekly spaced data set. The gray bars are the frequency distribution of number of transitions from 500 model simulations. The vertical bar is the observed number of transitions. CTMM, continuous‐time Markov model; DTMM, discrete‐time Markov model; PO, proportional odds model.