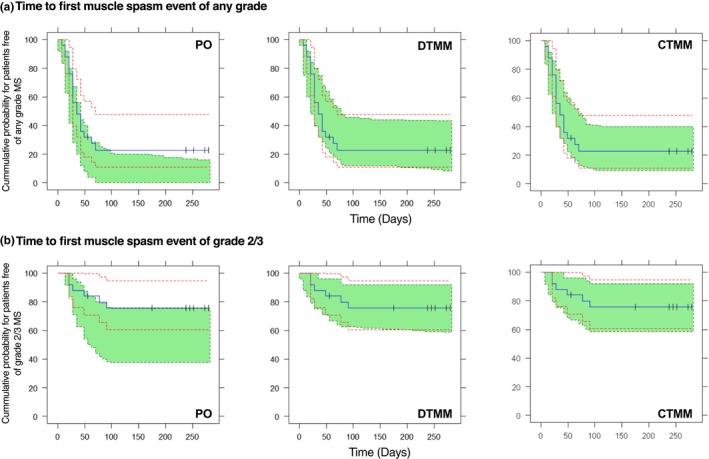
Figure 4.

Visual predictive check for Kaplan‐Meier plot for time to first MS event of any grade (a) and or grade 2/3 (b) in cohort 2 based on the weekly spaced data set. Blue lines are the observed curve, green area is 95% prediction interval of model predictions, and red dash lines are the 95% confidence interval of the observed curve. CTMM, continuous‐time Markov model; DTMM, discrete‐time Markov model; MS, muscle spasm; PO, proportional odds model.
