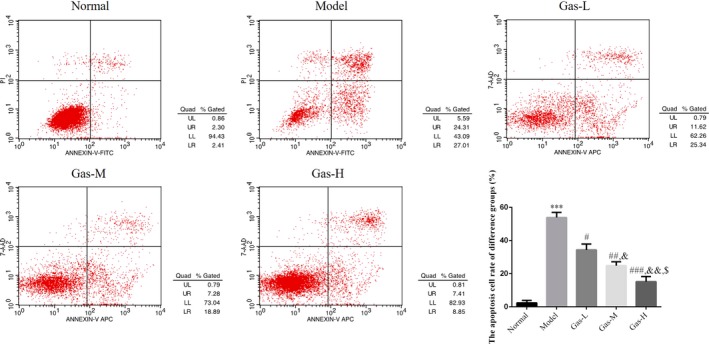
Figure 4.

The cell apoptosis rate of different groups by flow cytometry. Normal: Normal control group; Model: The HTR/SVneo cells were treated with hypoxia; Gas‐L: The HTR/SVneo cells were treated with 50 mg/ml gastrodin hypoxia; Gas‐M: The HTR/SVneo cells were treated with 100 mg/ml gastrodin hypoxia; Gas‐H: The HTR/SVneo cells were treated with 200 mg/ml gastrodin hypoxia. ***p < .001, compared with Normal group; #p < .05, ##p < .01, ###p < .001, compared with Model group; &p < .05, &&p < .01, compared with gas‐L group; $p < .05 compared with gas‐M
