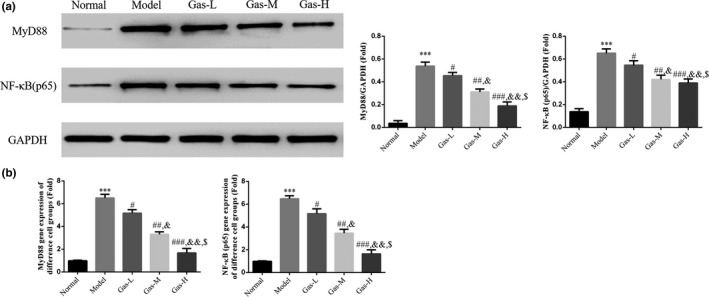
Figure 5.

The relative mRNA and protein expressions by RT‐qPCR and WB assay. (a) The relative protein expressions of different groups by WB assay. Normal: Normal control group; Model: The HTR/SVneo cells were treated with hypoxia; Gas‐L: The HTR/SVneo cells were treated with 50 mg/ml gastrodin hypoxia; Gas‐M: The HTR/SVneo cells were treated with 100 mg/ml gastrodin hypoxia; Gas‐H: The HTR/SVneo cells were treated with 200 mg/ml gastrodin hypoxia. ***p < .001, compared with Normal group; #p < .05, ##p < .01, ###p < .001, compared with Model group; &p < .05, &&p < .01, compared with gas‐L group; $p < .05 compared with gas‐M. (b) The relative mRNA expression of different groups by RT‐qPCR assay. Normal: Normal control group; Model: The HTR/SVneo cells were treated with hypoxia; Gas‐L: The HTR/SVneo cells were treated with 50 mg/ml gastrodin hypoxia; Gas‐M: The HTR/SVneo cells were treated with 100 mg/ml gastrodin hypoxia; Gas‐H: The HTR/SVneo cells were treated with 200 mg/ml gastrodin hypoxia. ***p < .001, compared with Normal group; #p < .05, ##p < .01, ###p < .001, compared with Model group; &p < .05, &&p < .01, compared with Gas‐L group; $p < .05 compared with Gas‐M
