Fig. 3.

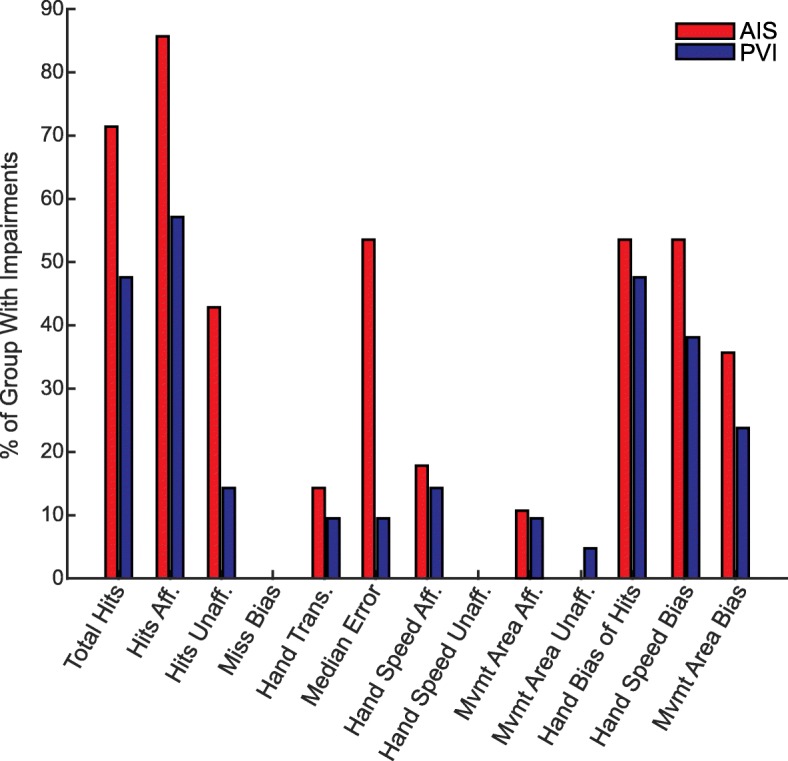
Percentage of Children with Impairments. Children who fell outside the 95% prediction bands were determined to be impaired. For each parameter, the percentage of the AIS (red) and PVI (blue) groups with impairments are shown

Percentage of Children with Impairments. Children who fell outside the 95% prediction bands were determined to be impaired. For each parameter, the percentage of the AIS (red) and PVI (blue) groups with impairments are shown