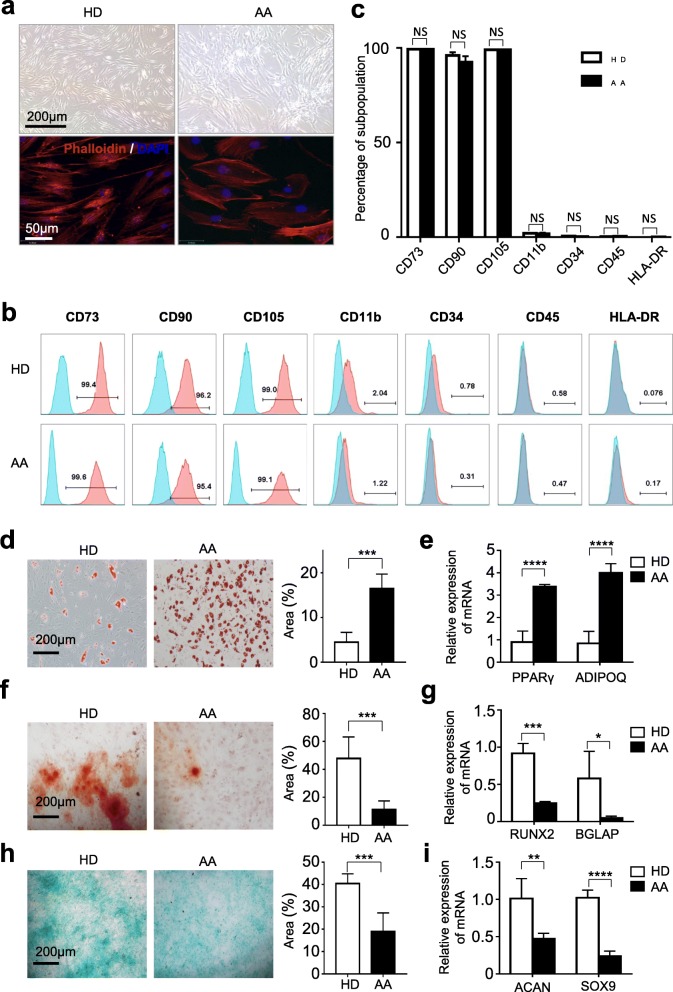
Fig. 2.
Comparisons of the morphology, identification, and tri-linage differentiation capacity of BM-MSCs between AA and HDs. a Distinguishable morphology of MSCs from AA and HDs. b, c The identification of MSCs from AA and HDs by flow cytometry (HD: n = 3; AA: n = 3). d, e The capacity of adipogenic differentiation by Oil Red O staining (HD: n = 5; AA: n = 5). Meanwhile, the adipogenesis-associated genes (PPARγ and ADIPOQ) were detected (HD: n = 4; AA: n = 4) by qRT-PCR. f, g The capacity of osteogenic differentiation by Allizarin Red staining (HD: n = 5; AA: n = 5). And the osteogenesis-associated genes (RUNX2 and BGLAP) were also detected (HD: n = 4; AA: n = 4). h, i The chrondrogenic differentiation capacity by Alcian blue staining (HD: n = 5; AA: n = 5) and the chondrogenesis-associated genes (ACAN and SOX9) by qRT-PCR (HD: n = 4; AA: n = 4)

