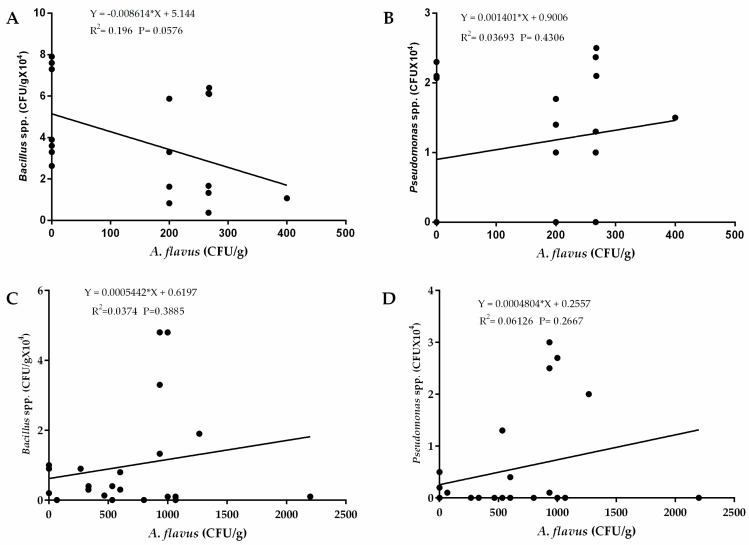
Figure 6.
Regression analysis between occurrence of A. flavus and Pseudomonas spp. and Bacillus spp. in soils sampled from western and eastern regions of Kenya. (A) Regression analysis between A. flavus and Bacillus spp.; (B) and Pseudomonas spp. in the western region of Kenya. (C) Regression analysis between A. flavus and Bacillus spp.; (D) and Pseudomonas spp. in the eastern region of Kenya. The vertical axis represents average occurrence (CFU/g) of bacteria while the horizontal axis represents average occurrence of A. flavus.

