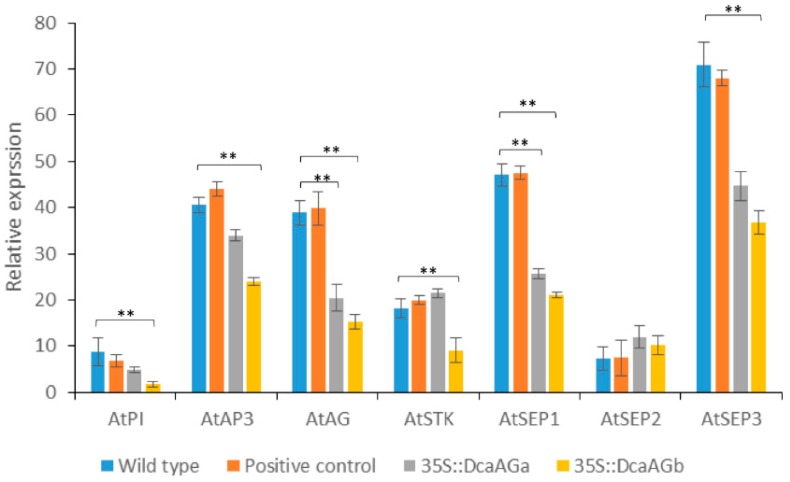
Figure 8.
Quantitative PCR analysis of AtPI, AtAP3, AtAG, AtSTK, AtSEP1, AtSEP2, and AtSEP3 in wild type, positive control group, 35::DcaAGa and 35::DcaAGb transgenic Arabidopsis. The expression of AtPI, AtAP3, AtAG, AtSTK, AtSEP1, and AtSEP3 in transgenic Arabidopsis show a significant difference, compared to the wild type and positive control group plant. ** indicates p < 0.01 by student’s t-test. Positive control represents the plants are transformed with pCAMBIA2300s vector.

