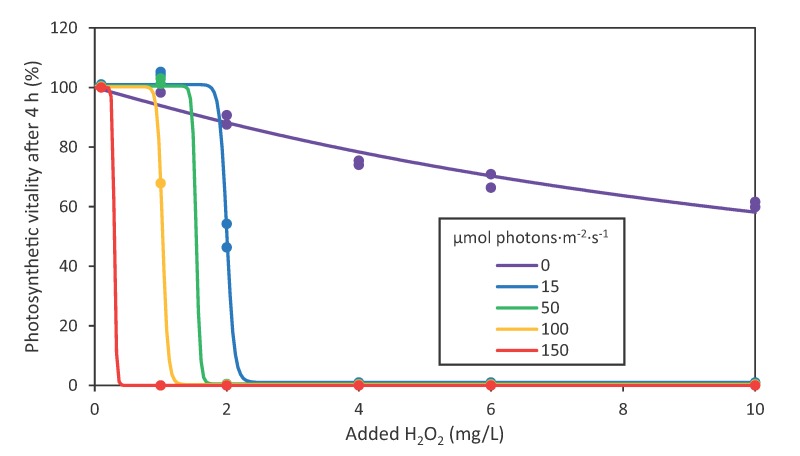
Figure 2.
Dose–response models of the photosynthetic vitality after 4 h as function of the added H2O2 concentration. Dots represent the data of two independent biological replicates per H2O2 concentration. The colored lines represent the dose–response models of the photosynthetic vitality of Microcystis as function of the H2O2 concentration fitted with nonlinear regression for each light intensity (n = 12 data points per light intensity).

