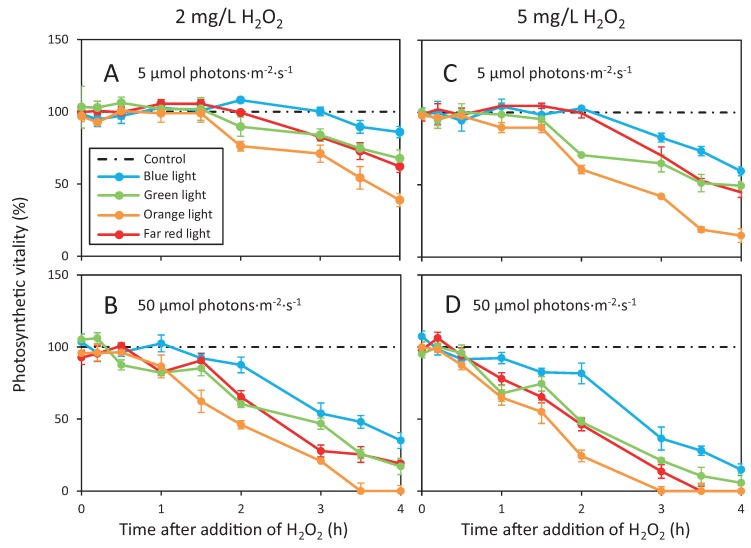
Figure 5.
Effects of different light colors on the photosynthetic vitality after addition of H2O2. The graphs show the decrease in photosynthetic vitality of Microcystis PCC 7806 in blue (450 nm), green (530 nm), orange (630 nm) and far red light (730 nm) after H2O2 addition of (A,B) 2 mg/L and (C,D) 5 mg/L. For each light color, Microcystis was exposed to a light intensity of (A,C) 5 µmol photons·m−2·s−1 and (B,D) 50 µmol photons·m−2·s−1. Photosynthetic vitality is defined as the photosynthetic yield of cells treated with H2O2 as a percentage of the control samples of cells not exposed to H2O2. Symbols represent the average ± standard deviation (SD) of four biological replicates. Dashed black lines represent the control without H2O2.

