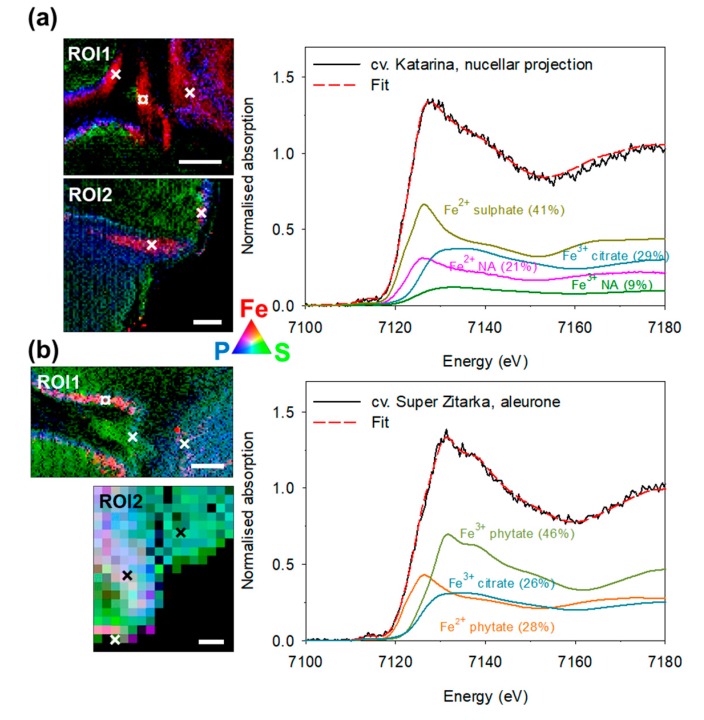
Figure 5.
Co-localisation images of iron (Fe) in red, sulphur (S) in green and phosphorus (P) in blue in the two regions of interest (ROI): the crease (ROI1) and the scutellum (ROI2) in the frozen-hydrated grain of wheat (Triticum aestivum L.) cultivar Katarina (a) and Super Zitarka (b), the awnletted wheat cultivars. × indicates pixels where Fe K-edge micro-XANES spectra were recorded and ¤ indicates where the selected Fe K-edge micro-XANES spectra (solid line) was recorded and is displayed on the right-hand side. The best linear combination fit (red dashed line) was obtained by the spectra of the reference Fe compounds. The relative amount of each component is given in parentheses. eV—electron volts; NA—nicotianamine. Scale bars = 200 µm. Quantitative distribution maps of Fe, P and S can be found in Figure S5.

