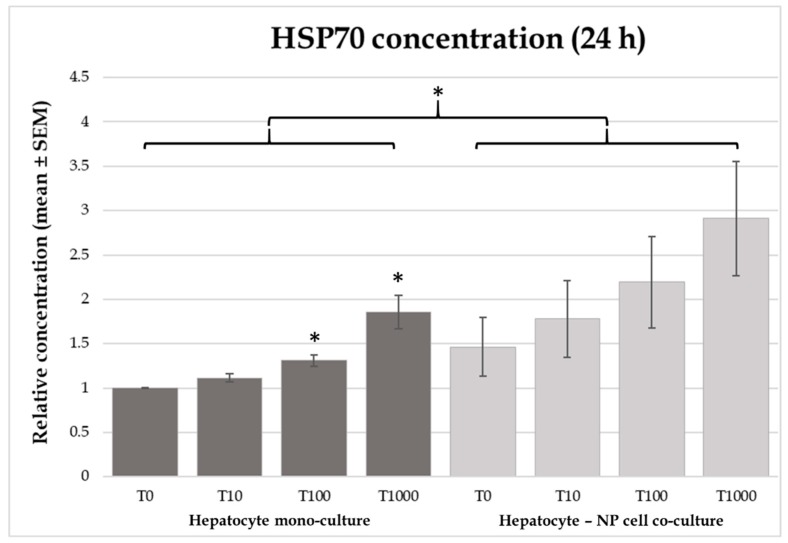
Figure 3.
Effects of T-2 toxin treatment on HSP70 production of chicken-derived primary hepatocyte mono- and hepatocyte—nonparenchymal cell co-cultures with the cell ratio of 6:1 (hepatocytes to nonparenchymal cells). Cells after 24 h culturing were treated with different concentrations of T-2 toxin for 8 or 24 h. “T0” refers to control group (without T-2 toxin treatment); “T10” refers to 10 nmol/L T-2 toxin treatment; “T100” refers to 100 nmol/L T-2 toxin treatment; T1000 refers to 1000 nmol/L T-2 toxin treatment. HSP70 concentrations were measured by chicken specific ELISA tests. Relative concentrations were calculated by considering the mean value of T0 hepatocyte mono-cultures as 1. Results are expressed as mean ± SEM. * p < 0.05. n = 3/group.

