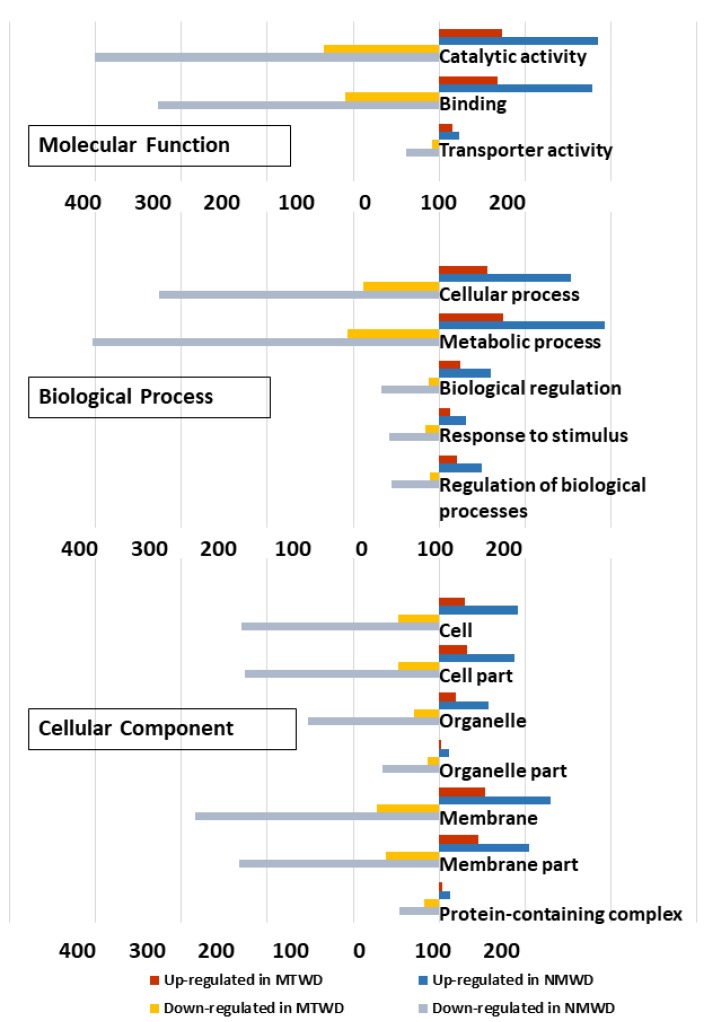
Figure 6.
Gene ontology classification of differentially expressed genes in T. chinensis (TC) and T. ramosissima (TR). Differentially expressed gene ontology terms were functionally classified and visualized with Web Gene Ontology Annotation Plot (WEGO, version 2.0). Blue and red bars represent the number of genes up-regulated in TC_water deficit treatment (WD) and TR_WD relative to their respective well-watered control. Gray and yellow bars represent the number of down-regulated genes in TC_WD and TR_WD relative to their respective well-watered control.

