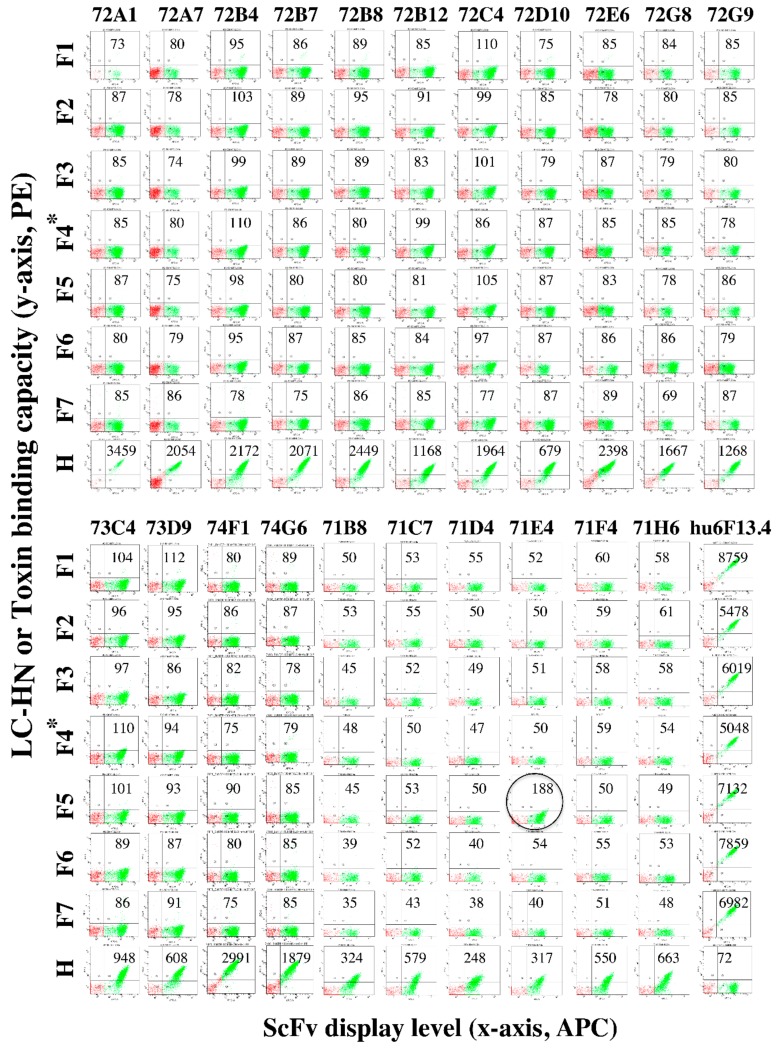
Figure 4.
Dot plots of the specificity of BoNT/H LC-HN scFv for BoNT/F subtypes. Yeast-displayed BoNT/H LC-HN scFv were incubated with 100 nM of the indicated BoNT/F LC-HN subtype, BoNT/F4 holotoxin (indicated with an * in the Figure) or BoNT/H LC-HN. Yeast-displayed hu6F13.4 was used for a control. BoNT/F subtype binding and BoNT/H LC-HN binding was detected with IgG 6F5.4 and 6H1 (for 74F1 and 74G6). Only scFv 71E4 (result circled) showed weak binding to BoNT/F5 LC-HN, while other scFv did not show any binding to BoNT/F subtypes. The level of BoNT binding is indicated on the y-axis and the level of scFv display is shown on the x-axis. The gated populations shown in green are those yeasts displaying scFv on their surface. Mean fluorescent intensity (MFI) values are shown within each dot-plot. The negative control MFI (yeast stained with secondary antibody only) was 94.2 ± 15.7. A test MFI > two standard deviations from control (>125.6) was considered positive for binding BoNT.

