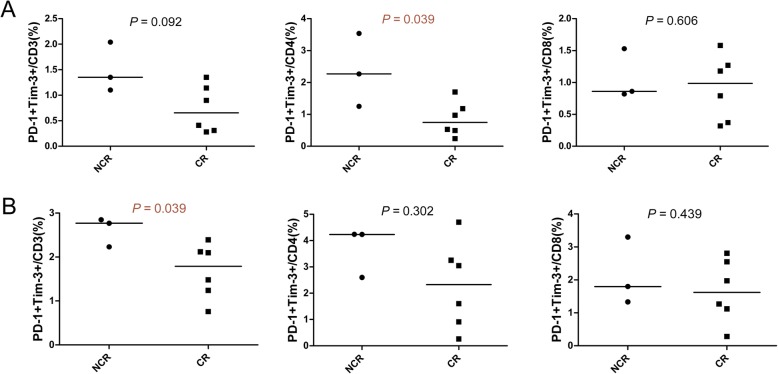
Fig. 4.
Differences in the distribution of PD-1+ T cells in BM and PB between patients with complete remission and those with non-complete remission after first-cycle chemotherapy as measured by flow cytometry analysis. A: Comparison of the percentage of PD-1 + Tim-3 + CD3+, CD4+, and CD8+ T cells in PB from patients in complete remission (CR, n = 6) and non-complete remission (NCR, n = 3). B: Comparison of the percentage of PD-1 + Tim-3 + CD3+, CD4+, and CD8+ T cells in BM from patients in the CR and NCR groups

