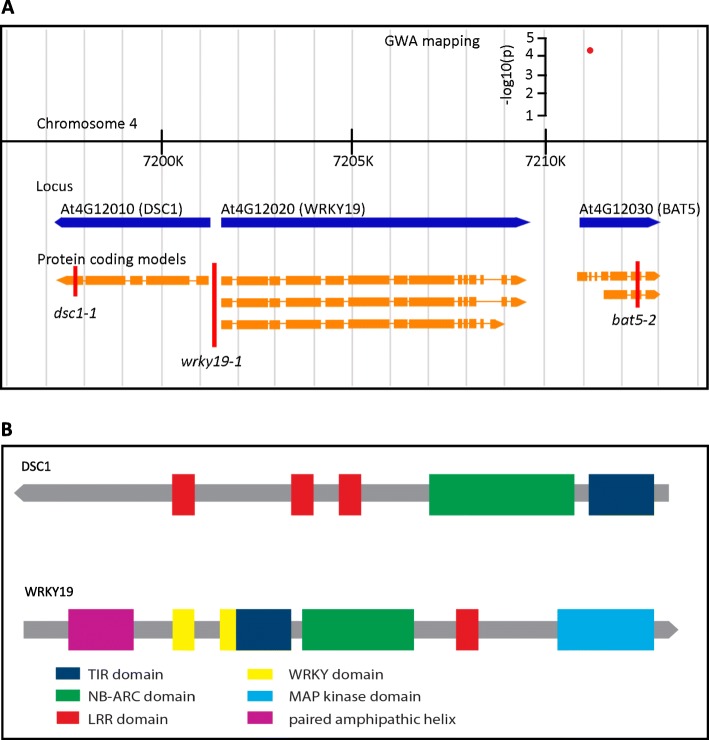
Fig. 1.
Genomic orientation of BAT5, WRKY19 and DSC1, including the protein domains present in WKRY19 and DSC1. a, Representation of the genomic region around significantly associated SNP marker 138,422. The red dot represents the SNP with the corresponding –log10(p) score from the genome wide association mapping. The blue arrows represent the predicted genes. Transcripts derived from these genes are indicated in orange, with rectangles marking the protein coding exons. The red vertical line indicates a T-DNA insert with the corresponding name. b, Schematic representation of protein domains present in DSC1 and WRKY19. Colored blocks represent the different domains present in the protein sequence

