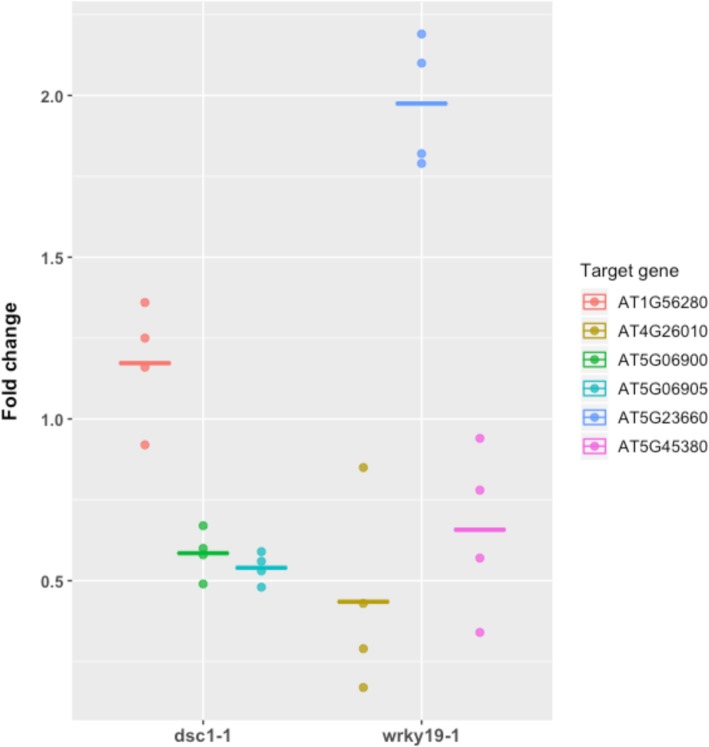
Fig. 6.
Relative expression of a selected set of genes identified in the microarray of dsc1–1 or wrky19–1 mutant plants (Table 1) relative to the wildtype Arabidopsis Col-0 background as determined by quantitative reverse-transcription PCR. Expression levels shown are represented as fold change measured in plants infected by M. incognita at the same time of inoculation (dpi =7). The data of each gene set consist of four biological replicates each comprising of three technical replications. Crossbar represents mean fold change

