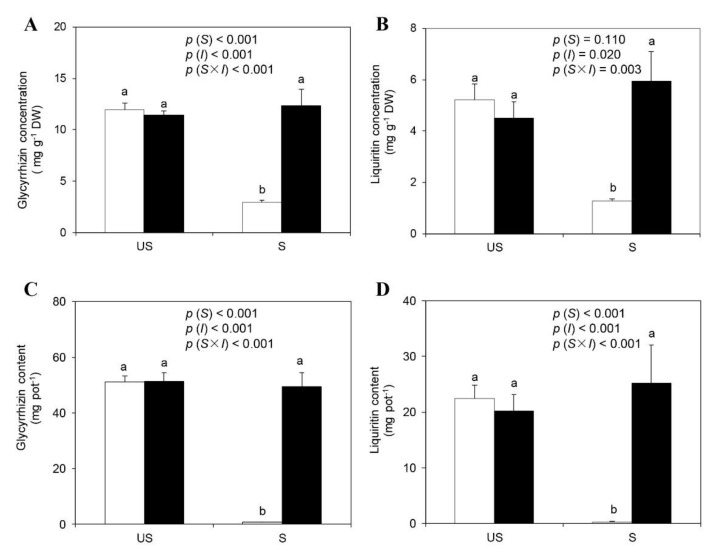
Figure 2.
Liquorice root glycyrrhizin (A) and liquiritin (B) concentrations and glycyrrhizin (C) and liquiritin (D) contents under different treatments (□ non-inoculation; ■ AM inoculation). US and S represent unsterilization and sterilization treatment, respectively. Data are presented as means ± SE (n = 4). Treatment effects (S: Sterilization; I: Inoculation) are tested by two-way ANOVA and are shown as p values in the figure. Different lowercase letters above the columns indicate a significant difference between corresponding treatments at p < 0.05 by Tukey’s HSD test.

