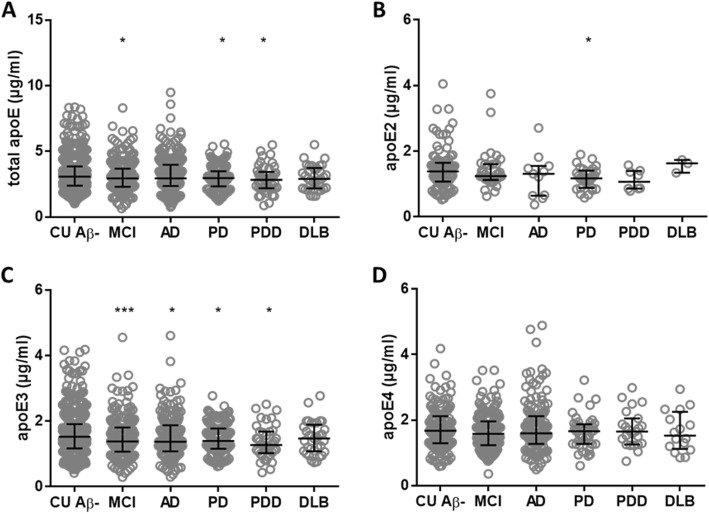
Fig. 2.
The CSF concentration of apoE in clinically diagnosed neurodegenerative disorders. CSF concentrations of total apoE (a), apoE2 (b), apoE3 (c), and apoE4 (d) for cognitively unimpaired Aβ− controls (CU Aβ−), mild cognitive impairment (MCI), Alzheimer’s disease (AD), Parkinson’s disease (PD), pervasive developmental disorder (PDD), and dementia with Lewy bodies (DLB). In the comparisons of apoE isoforms, the individuals were either heterozygous or homozygous for the specific genotype (the concentrations in homozygous individuals were divided by two). The horizontal lines represent the median and interquartile ranges. Significance: * = p < 0.05, *** = p < 0.001 compared to the CU Aβ− group

