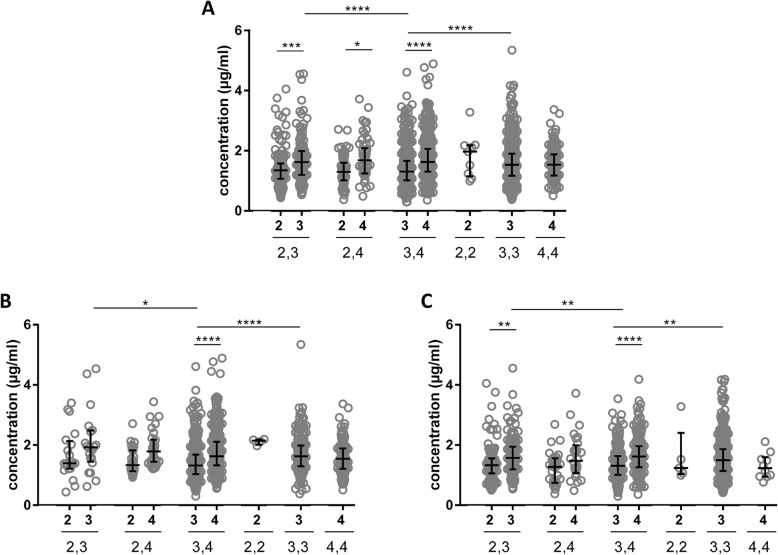
Fig. 3.
The CSF apoE isoform-specific concentrations. The apoE isoform concentrations are shown for all six genotypes for all patients combined (a) and when dichotomized into Aβ+ (b) and Aβ− (c) groups. In the comparisons of apoE isoforms, the concentrations in homozygous individuals were divided by two. The horizontal lines represent the median and interquartile ranges. Significance: * = p < 0.05, ** = p < 0.01, *** = p < 0.001, **** = p < 0.0001

