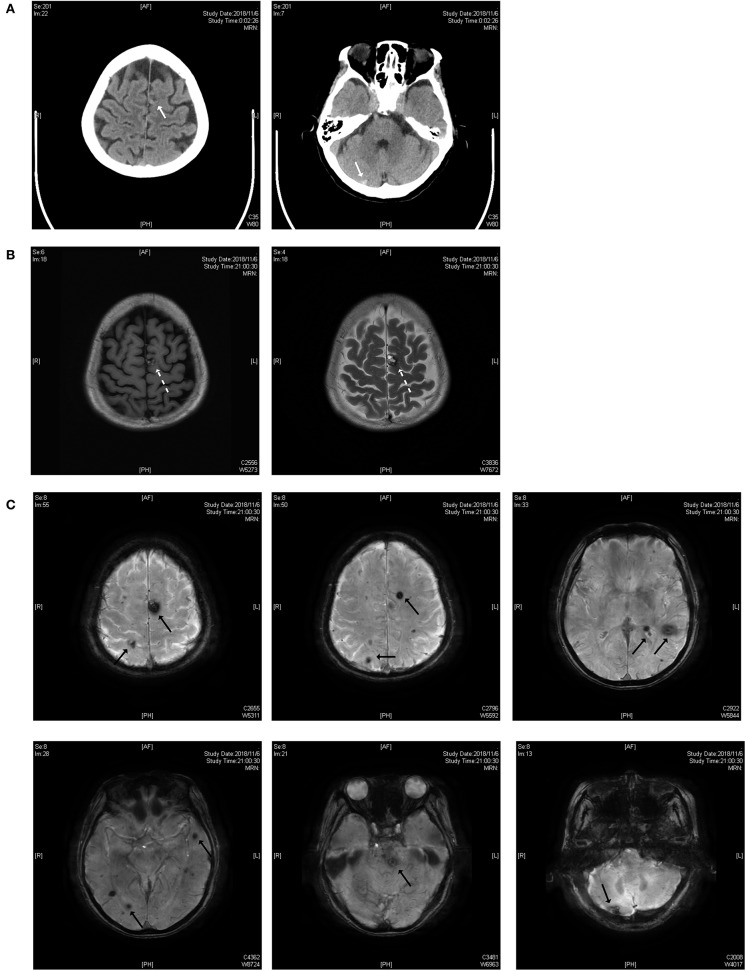
Figure 1.
(A) Brain CT scan. The white solid arrows show a mixed-density lesion on the left parietal lobe and a high-density lesion on the right cerebellum. (B) T1 and T2 weighted images of the MRI scan. The dotted arrow indicates a popcorn-like mixed signal on T1WI and a high-signal lesion with a hemosiderin deposit surrounded on the T2 weighted image. (C) Susceptibility-weighted imaging (SWI). Black solid arrows indicate the lesions on the parietal lobe, temporal lobe, brainstem and cerebellum.

