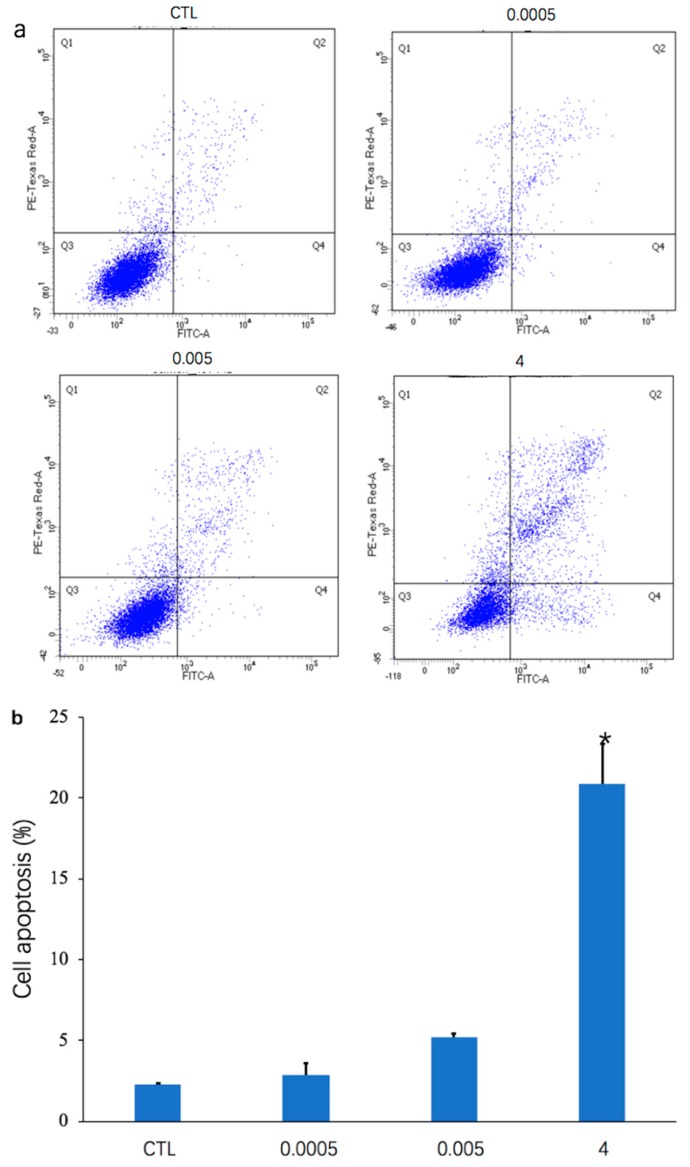
Figure 1.
Effects of ochratoxin A (OTA) on apoptosis in differentiated Caco-2 cells. Incubation of cells for 48 h with OTA (0, 0.0005, 0.005, and 4 μg/mL) was followed by analysis using flow cytometry. (a) Representative flow cytometry plots are presented for the control group (CTL) and OTA groups (0.0005 μg/mL, 0.005 μg/mL, and 4 μg/mL). (b) Histogram showing number of differentially expressed genes after treatment with three concentrations of OTA compared with the control group. * represents a significant difference (p < 0.05).

