Abstract
The flow of viscoelastic fluids in channels and pipes remains poorly understood, particularly at low Reynolds numbers. Here, we investigate the flow of polymeric solutions in straight channels using pressure measurements and particle tracking. The flow friction factor fη versus flow rate exhibits two regimes: a transitional regime marked by rapid increase in drag, and a turbulentlike regime characterized by a sudden decrease in drag and a weak dependence on flow rate. Lagrangian trajectories show finite transverse modulations not seen in Newtonian fluids. These curvature perturbations far downstream can generate sufficient hoop stresses to sustain the flow instabilities in the parallel shear flow.
Fluids containing polymers are found in everyday life (e.g., foods and cosmetics) and in technology spanning the oil, pharmaceutical, and chemical industries. A marked characteristic of polymeric fluids is that they often exhibit non-Newtonian flow behavior such as viscoelasticity [1,2]. Mechanical (elastic) stresses in such fluids are history dependent and develop with timescale λ, which is proportional to the time needed for a single polymer molecule to relax to its equilibrium state in dilute solutions. These stresses grow nonlinearly with shear rate and can dramatically change the flow behavior [1,2]. For example, the presence of the polymer in turbulent pipe flows can suppress eddies and leads to large reduction in flow friction [3,4]. At low Reynolds numbers (Re), where inertia is negligible, elastic stresses can lead to flow instabilities not found in ordinary fluids like water [5–12]. They can also exhibit a new type of disordered flow—elastic turbulence—a turbulentlike regime existing far below the dissipation scale [13–16].
Recently, there has been mounting evidence that the flow of viscoelastic polymeric solutions in pipe and channel flows is nonlinearly unstable and undergoes a subcritical instability at sufficiently high flow rates even at low Re [12,17–22]. We note that this nonlinear elastic instability is different from the linear instability found in highly shear-thinning fluids [23–26]; the base flow of the former is stable while the latter is unstable. Each is important in its own right. Theoretical investigations using Oldroyd-B-type model and nonlinear perturbation analysis show that a subcritical bifurcation can arise from linearly stable base states [17,19,20,27], while nonmodal stability analysis predicts transient growth of perturbation [28–30]. Subsequent experiments in small pipes found unusually large velocity fluctuations that are activated at many timescales [21], as well as hysteretic behavior [18]. More recently, experiments in a long microchannel using a linear array of cylinders as a way to perturb the (viscoelastic) flow showed an abrupt transition to irregular flow and that the velocity fluctuations are long lived [12,22]. The unstable flow exhibits features of Newtonian turbulence such as power-law behavior in velocity spectra, intermittency flow statistics, and irregular structures in the streamwise velocity fluctuation [22]. Taken together, these results show that polymeric solutions flowing in straight channels can undergo a subcritical transition—a sudden onset of sustained velocity fluctuations above a perturbation threshold and a critical flow rate. This scenario is akin to the transition from laminar to turbulent flow of Newtonian fluids in pipe flows [31,32]. The main distinction is that the instability is caused by the nonlinear elastic stresses and not inertia. Unlike the Newtonian pipe turbulence, however, little is known about the basic structures organizing the instability and the law of resistance (i.e., pressure loss due to friction) as the flow transitions from a stable to an unstable state.
In this Letter, we investigate the flow of polymeric solutions in a straight microchannel at low Re using pressure measurements and particle tracking methods. Pressure measurements show that the flow resistance increases relative to the stable viscoelastic base flow, following the transition from a laminar to “turbulentlike” state, cf. Fig. 1(c). This behavior is analogous to Newtonian turbulence where the friction factor increases as the flow transitions from laminar to turbulent except that here the governing parameter is the Weissenberg number (Wi), defined as the product of the fluid relaxation time λ and the flow shear rate . The rise in flow resistance is related to enhanced elastic stresses and suggests flow patterns not seen in the (viscoelastic) laminar regime. We find that, far downstream from the initial perturbation, tracer particles follow wavy trajectories with spanwise modulation not found in the stable unperturbed flow (cf. Fig. 5). We believe that the increase in flow resistance is connected to the appearances of these wavy particle motions. A friction factor scaling (i.e., flow resistance vs pressure drop) for viscoelastic channel flows is proposed to capture this increase in drag.
FIG. 1.
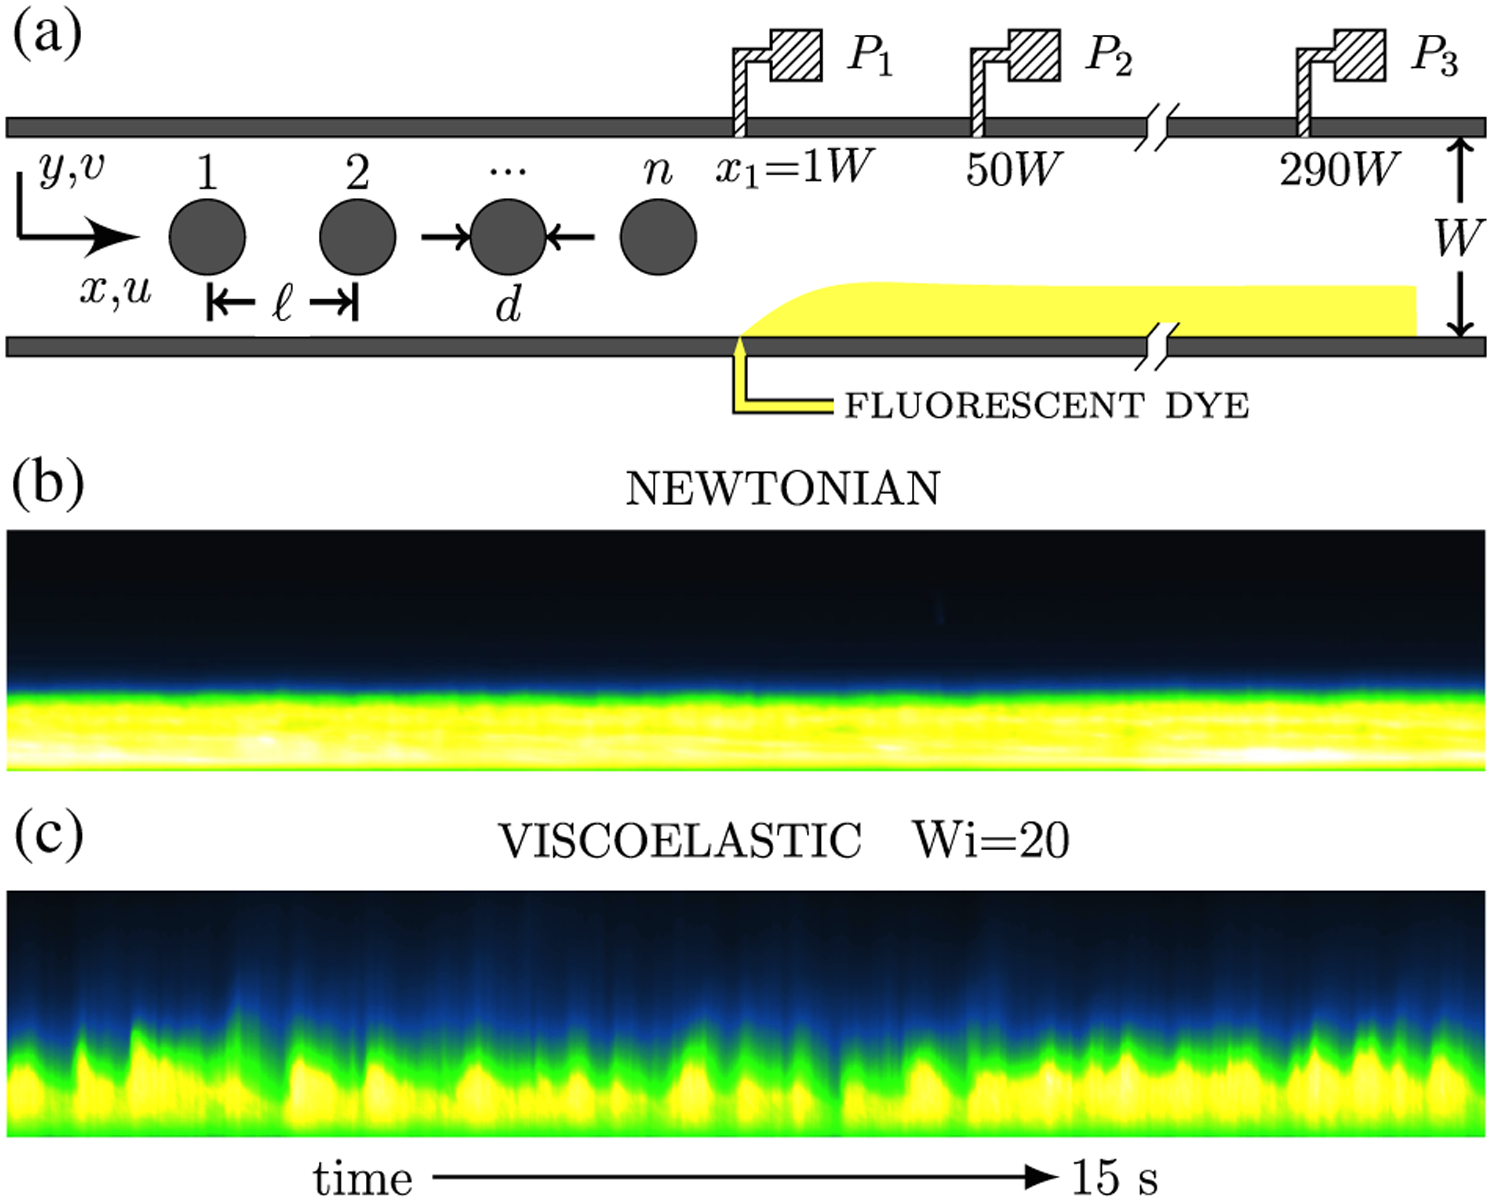
(a) Schematic of the microchannel, showing location of pressure sensors and the dye injection scheme. [(b) and (c)] Spacetime dye patterns for n = 15 and x = 200 W in the parallel shear region, (c) viscoelastic fluid at Wi = 20, and (b) the Newtonian case at identical flow rate.
FIG. 5.
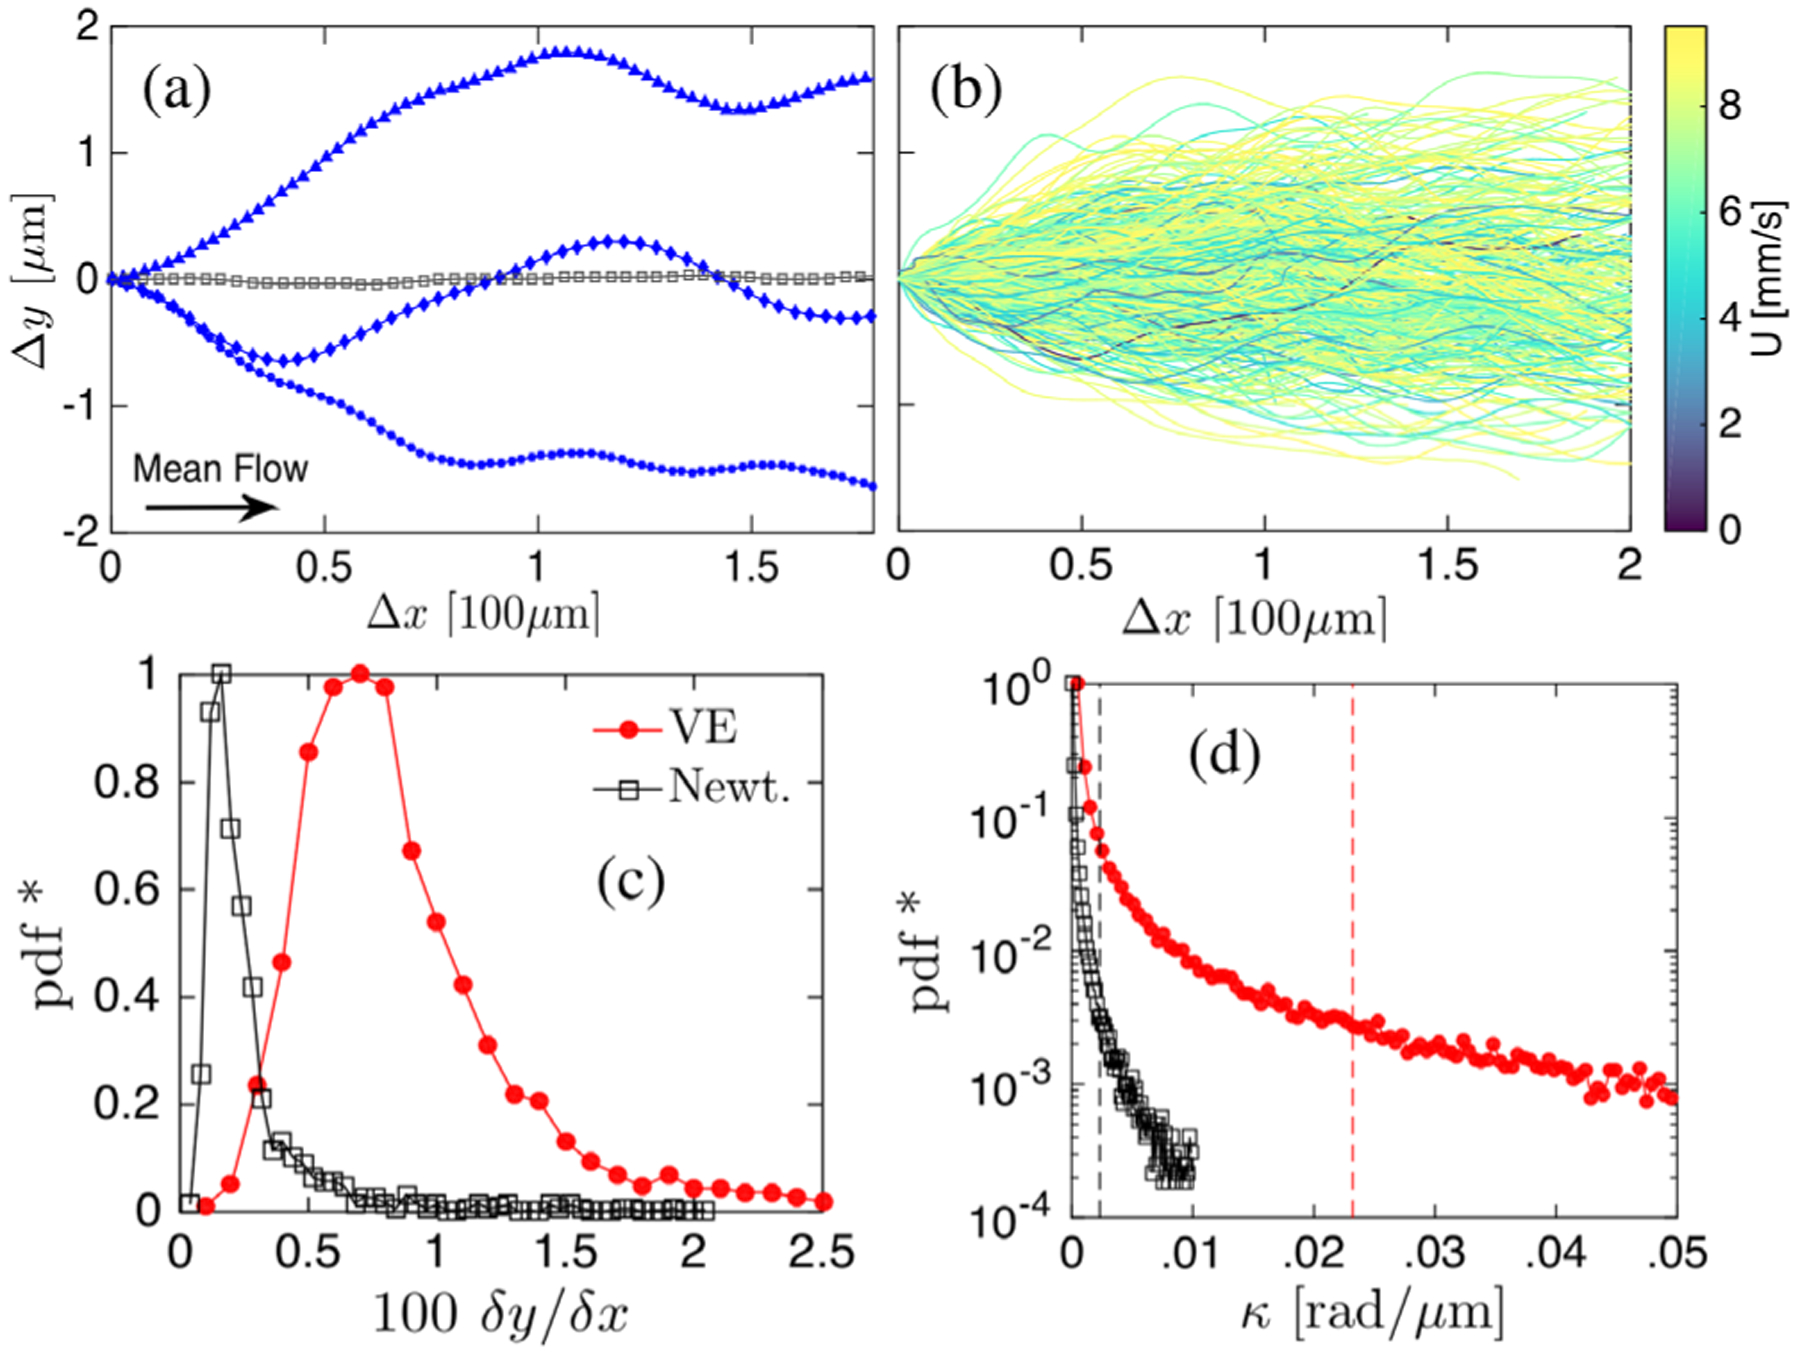
(a) Particle trajectories in the streamwise (x) and spanwise (y) direction; blue lines represent the n = 15 viscoelastic case at Wi = 18 and the gray line is Newtonian at identical conditions. (b) Collection of trajectories colored by speed. Distributions of (c) cumulative transverse to streamwise displacements and (d) trajectory curvatures, where the dashed line represents population mean.
Experiments are conducted using a straight microchannel with equal width and depth (W = D = 100 μm), fabricated using standard soft-lithography methods. The device schematic is shown in Fig. 1(a). The channel length is much larger than its width L/W = 330 and is divided into two regions. The first region consists of a linear array of fifteen cylinders (n = 15) that extends for 30 W, with the last cylinder located at x = 0. The diameter of the cylinder is d = 0.5 W and the center to center separation is l = 2 W. An unperturbed control case with no cylinders (n = 0) is used as the linearly stable viscoelastic case. The second region follows the array of cylinders and consists of a long parallel shear flow 300 W in length. To measure pressure signals, sensors are placed at three locations in the parallel shear region, x1 = 1 W, x2 = 50 W, x3 = 290 W [see Fig. 1(a)]. The pressure drop per length p1 (t) = (P1 −P2)/(x2 − x1) and p2(t) = (P2 − P3)/(x3 − x2) is recorded at 5 ms resolution for over 2 hours.
The main polymeric solution is prepared by adding 300 ppm of polyacrylamide (PAA, 18 × 106 MW) to a viscous Newtonian solvent (90% by mass glycerol aqueous solution); the PAA polymer overlap concentration c* is 350 ppm [33] and c/c* = 0.86. This weakly shear-thinning polymeric solution has a nearly constant viscosity of around η = 300 mPa s. The Newtonian solvent has constant viscosity of 220 mPa s and is also used for comparison. Throughout our experiment, the Reynolds number is kept below 0.01, where Re =ρUH/η, U is the mean centerline velocity, H is the channel half-width, and ρ is the fluid density. We characterize the strength of the elastic stresses compared to viscous stresses by the Weissenberg number [7], defined here as , where is the shear rate and N1 is the first normal stress difference (see Supplemental Material [34] for fluid rheology and residence time).
We begin by investigating the flow patterns formed when a stream of experimental fluid with added fluorescent dye is injected at x = 1 W after the last post. The dye spreading and patterns are then visualized far downstream in the parallel shear region, 200 W downstream from the last post. Figure 1 shows the spatiotemporal profile of the dye intensity along the device’s cross section (y) for a channel containing 15 posts (n = 15) for Newtonian [Fig. 1(b)] and viscoelastic [Fig. 1(c)] fluids. For the Newtonian case, the profile shows typical laminar dye layer with minimal dye penetration into the undyed stream, except for diffusion. (Similar behavior is observed with viscoelastic fluids for the n = 0 case.) A different dye pattern is observed when the Newtonian fluid is replaced by the polymeric solution under the same conditions. The viscoelastic case, shown in Fig. 1(c) at Wi ≈ 20, shows irregular flow patterns with spikes of dye penetration into the undyed fluid stream. The flow structure of streamwise velocity showed similar development downstream (Supplemental Material [34]). These fluctuations in time suggest flow modulations normal to the mean flow. In fact, we show later that particle trajectories exhibit wavy coherent motions in the parallel shear region.
As mentioned before, little is known about elastic turbulence in channel flows. Importantly, there is no known law of resistance for such flows. Here, we observe a new friction factor scaling for long chain polymeric solutions with weak shear thinning in straight channel flows. Figure 2 shows the mean pressure drop per length signals p1, p2 for viscoelastic fluids for n = 0 and 15 cases as a function of flow rate Q and Wi. We note that the statistical mean of the reported signals measures the aggregate flow resistance encountered to sustain a constant mass flow rate. As expected, the pressure drop or flow resistance increases with flow rate and Wi. The pressure drop for the n = 0 case slightly deviates from the Newtonian case (i.e., ΔP ~ Q) due to mild shear thinning in fluid viscosity. These effects can be accounted for by estimating the pressure drop using wall shear rate and corresponding viscosity measured using a cone-and-plate rheometer, as shown by the solid line in Fig. 2. No significant difference is found between p1 and p2for the n = 0 case as expected, since entrance effects are minimized by using a tapered inlet that generates minor disturbance relative to that of the cylinder array. For n = 15, we find a clear increase in pressure drop relative to the n = 0 case; the two pressure segments p1 and p2 show little to no difference. This increase in flow resistance cannot be explained by solely shear-thinning effects and is related to the development of additional elastic stresses in the flow as the Wi is increased. It also indicates that more energy is necessary to keep the same flow rate compared to a stable viscoelastic channel flow.
FIG. 2.
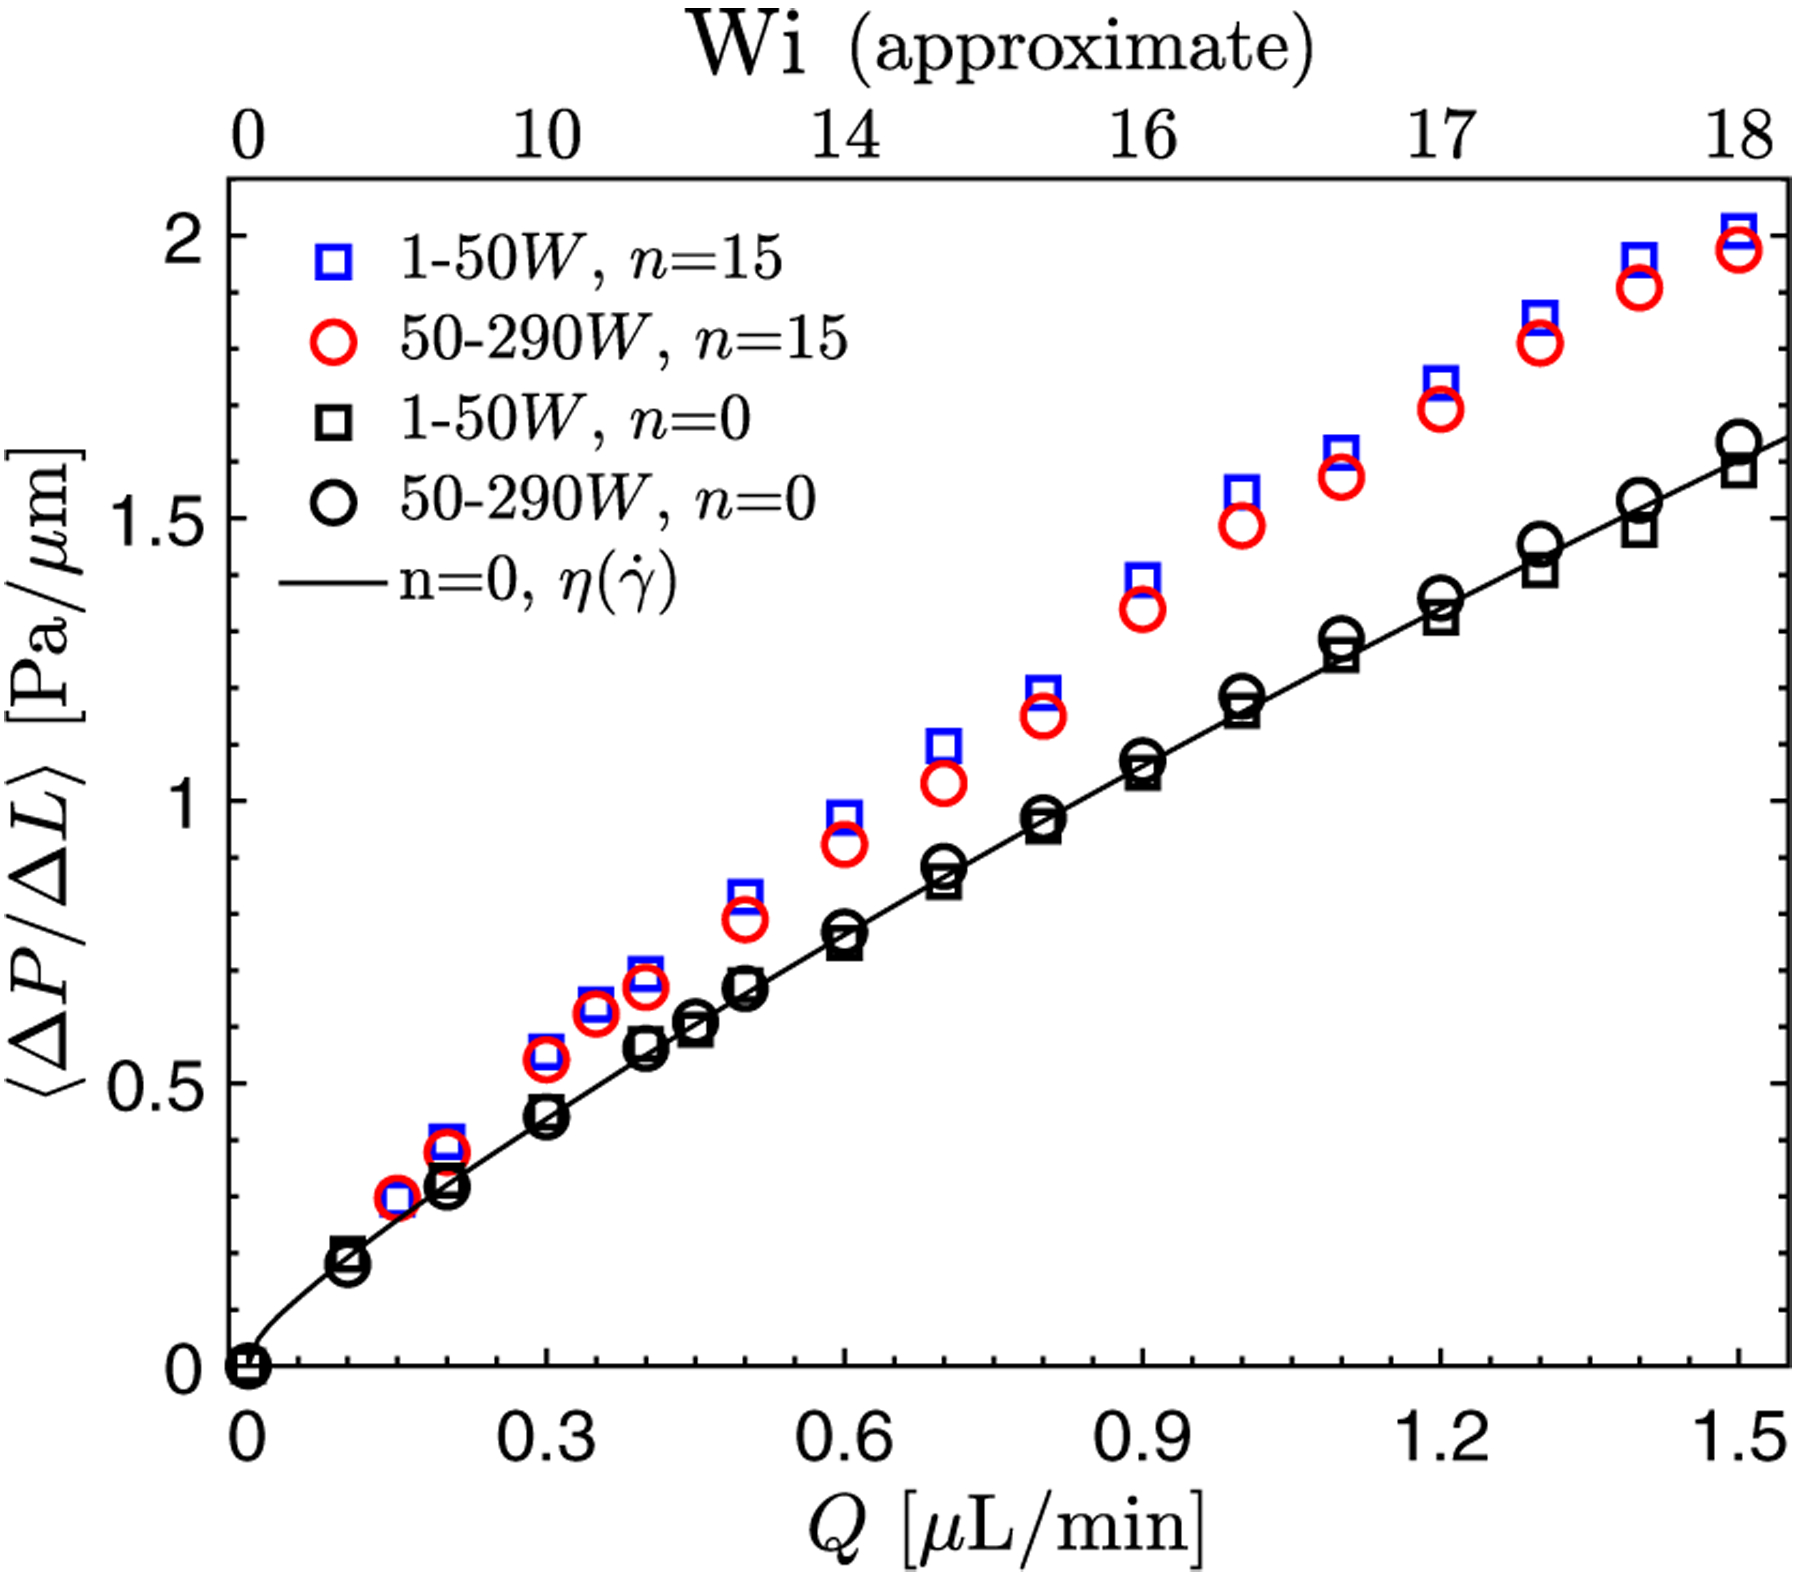
Pressure drop per unit length as a function of flow rate Q and Wi for n = 15 and n = 0 cases. The solid line represents estimation using wall shear rates and viscosity from rheology measurements. Error bars are less than marker size and not shown here.
The increase in flow resistance is closely associated with the onset of pressure fluctuations (Fig. 3). Figure 3(a) shows sample time records of pressure fluctuations p’1 (t) for viscoelastic fluids at Wi = 18 in devices with n = 0 (black) and 15 (blue). We observe a clear increase in the pressure fluctuations far downstream the cylinders once they are introduced in the flow. Figures3(a) and 3(b) show rms values of the pressure fluctuations of the p’1 and p’2 segments, respectively, as a function of Wi for the n = 15 and n = 0 cases. For the n = 0 case, pressure fluctuations remain relatively small and nearly independent of Wi; the small increase in pressure fluctuation at the higher values of Wi may be due to entrance effects. We find that for both segments, p’1 and p’2, the rms values show significant departure from the stable n = 0 case and a marked increased with increasing Wi. The values of the rms(p’1) and rms(p’2) start to depart from the n = 0 trend at Wi ≈ 5 and grow weakly until Wi ≈ 9. This is followed by a much steeper growth for Wi ≳ 9. This trend in pressure fluctuation measurements agrees relatively well with measurements of velocity fluctuations, for the n = 15 case, which established that the linear instability associated with the flow around the upstream cylinders occurs at Wi ≈ 4 and the onset of subcritical instability occurs at Wi ≈ 9 [12,22].
FIG. 3.
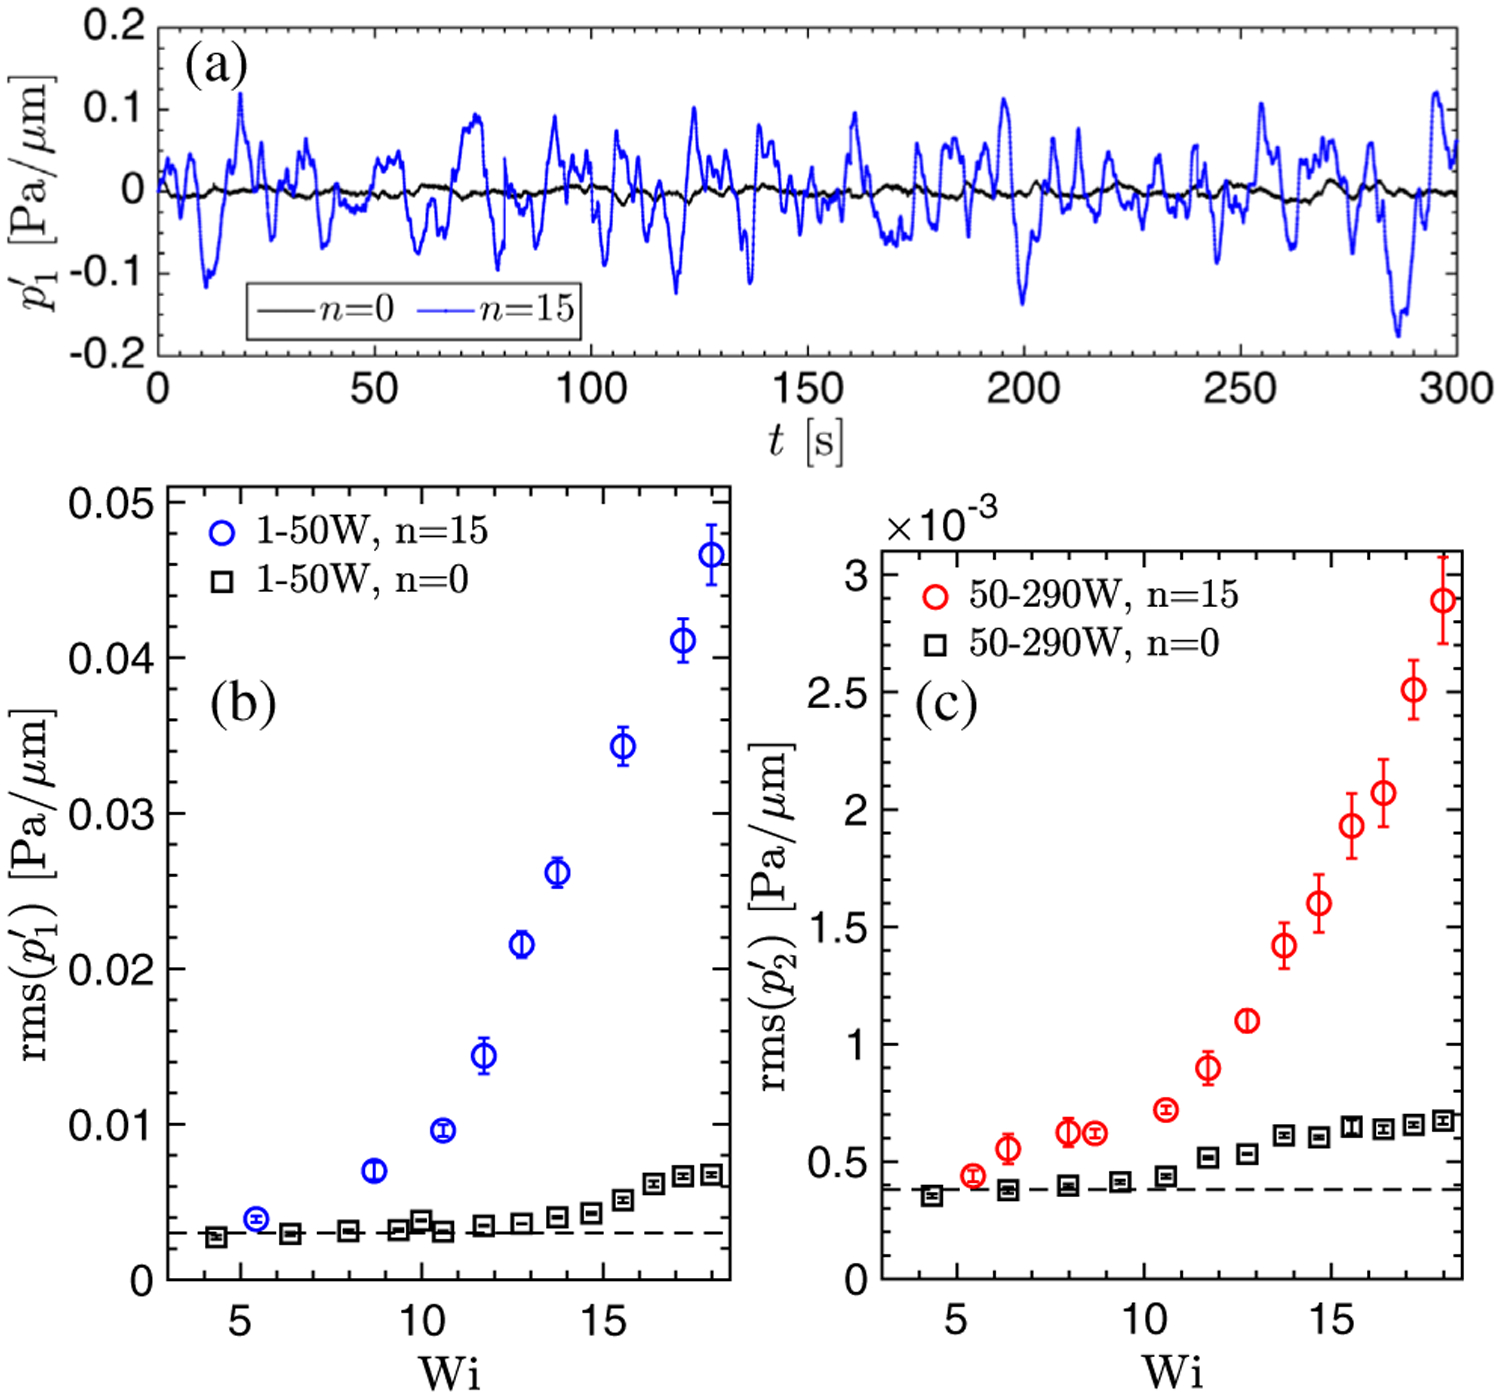
(a) Pressure gradient signal p’1(t) for the n = 15 case, compared with the unperturbed n = 0 case, Wi = 18. [(b) and (c)] Root-mean-square (rms) fluctuations versus Wi for n = 0 and 15, (b) p’1, and (c) p’2. The dashed line is the average level for Newtonian fluid, experimentally found to be constant for increasing Q.
Since pressure data are now available, one can investigate the law of flow resistance for viscoelastic channel flows as a function of Wi. This is analogous to measuring the Darcy friction factor for Newtonian pipe flows as a function of Re [37], traditionally defined as (ΔP/ΔL)/(ρU2/2W). For small geometry variations (e.g., smooth pipes), the friction factor f is solely a function of Re. In what follows, we propose that there is an analogous law of resistance for viscoelastic channel flows controlled by Wi. Since fluid inertia in our experiments is negligible (Re ≲ 10−3), we propose to scale the pressure drop by the viscous stresses across the channel and define a viscous friction factor fη as , where is the wall shear rate, ηw is the corresponding viscosity, and geometry factor c ≈ 4 for square duct (Supplemental Material [34]).
Figure 4 shows the friction factor fη versus Wi for the main polymeric fluid, as well as two other fluids with different polymer concentrations and solvent viscosity (see [34]) in channels with n = 0 and 15. For n = 0, the friction factor is independent of Wi, indicating that the flow resistance is purely governed by viscous drag well accounted for by the normalization. For n = 15, however, we observe an increase in flow resistance with fη ~ Wi1/3 up to Wi ≈ 9. Surprisingly, we find a second plateaulike regime for Wi ≳ 9 in which a sudden decrease in fη is observed followed by a weak dependence on Wi, valid before polymer finite extensibility occurs at Wi ≳ 16. This relative decrease in drag seems to suggest the emergence of a new flow state. The data in Fig. 4 suggest that the initial fη ~ Wi1/3 regime is likely a transitional state leading to a fully turbulentlike state. Similar to Newtonian pipe flows, a sharp increase in drag occurs during the transition regime before the flow becomes fully turbulent. We note the Wi1/3 scaling observed here is lower than the Wi1/2 scaling of injected power in the elastic turbulence of a swirling parallel plate system where the base flow is curved and linearly unstable [38].
FIG. 4.
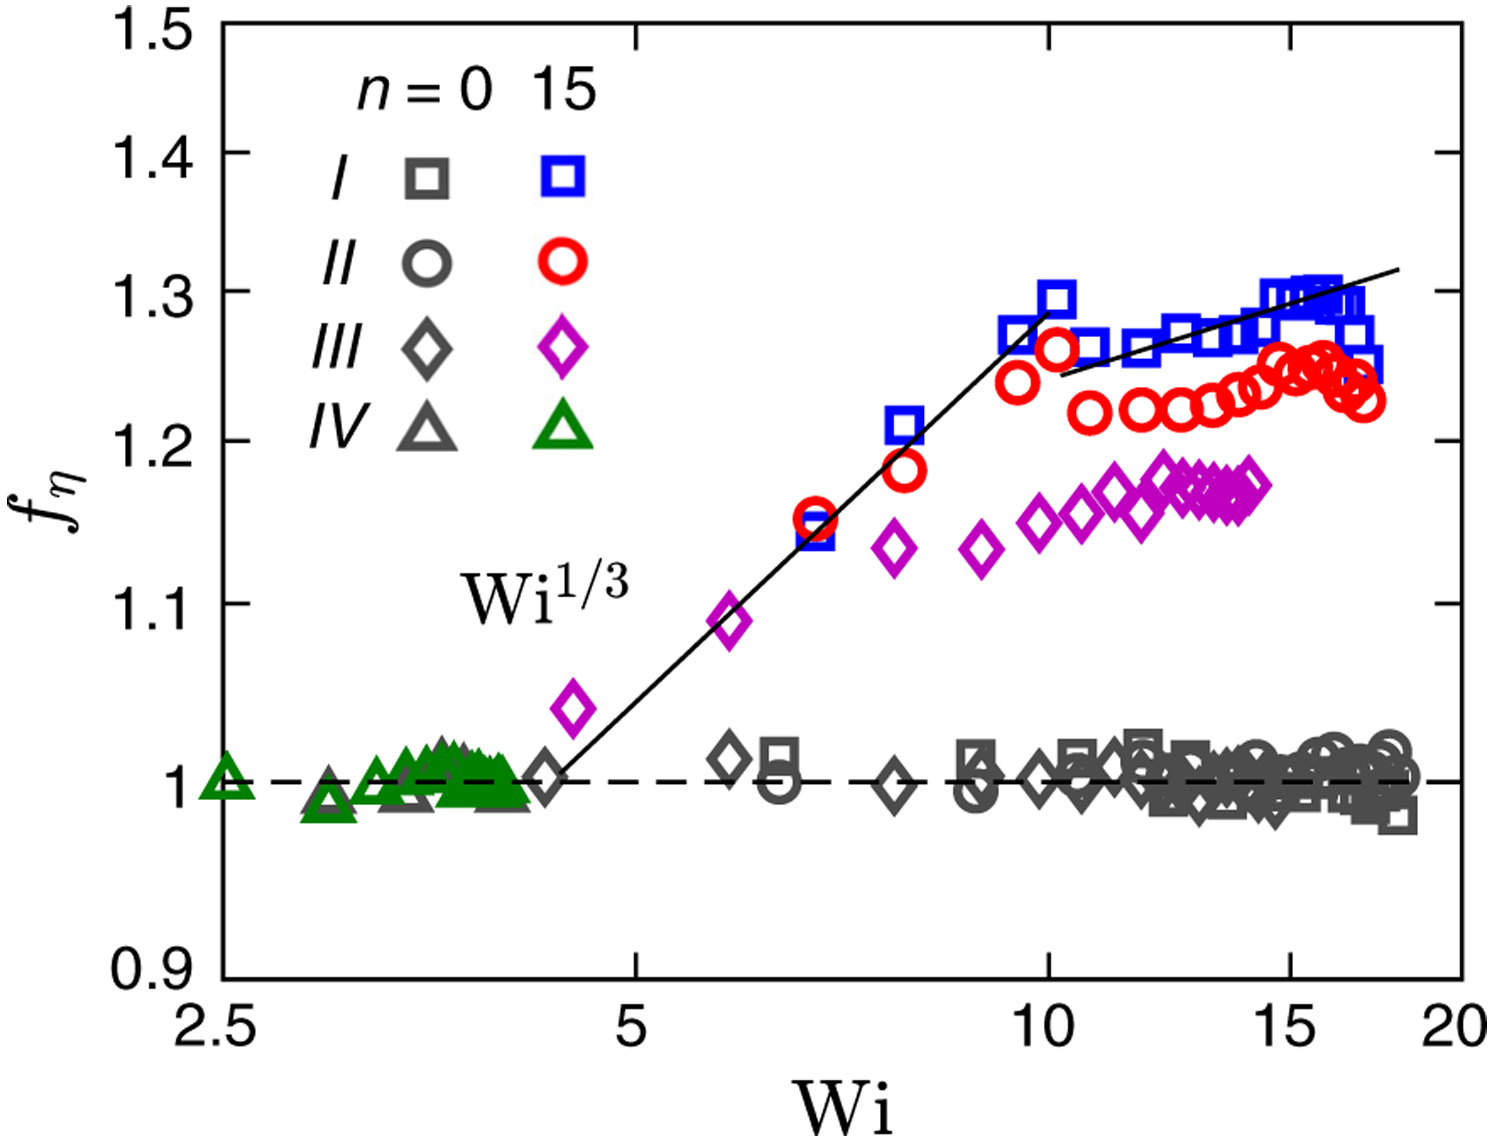
Viscous friction factor fη as a function of Wi for n = 0 and 15 with four cases and types of polymeric fluids. Case I: 300 ppm PAA 90% glycerol, 0–50 W, II: 50–290 W, III: 250 ppm PAA 90% glycerol, 0–290 W, IV: 100 ppm PAA 93% glycerol, 0–290 W.
Next, we investigate the structure of the viscoelastic flow for n = 15 and Wi = 18; this is the regime in which we expect highly irregular flow but quantifying the presence of flow structures has been difficult due to the weak spanwise velocity component relative to the mean shear [22]. To interrogate the flow with enough spatial and temporal resolution, we use a novel three-dimensional holographic particle tracking method [39,40]. The flow is seeded with tracers (1 μm diam at 0.001%) imaged under microscope and high speed camera (5000 fps). Using a coherent light source, particle positions are reconstructed from the light scattering field on the imaging plane (see [34]). The uncertainty in particle centroid is 30 nm for in-plane x, y components. The measurement window is located at x = 200 W in the parallel shear region and extends for 2.5 W streamwise and 0.9 W spanwise.
Figure 5(a) shows sample particle trajectories for the Newtonian (grey) and viscoelastic (blue) fluids for the n = 15 and Wi = 18. While the particle trajectory in the Newtonian case follows the mean flow with little lateral motion, particle trajectories in the viscoelastic fluid case display a relatively pronounced waviness and lateral movement. This is not isolated to a few particles and Fig. 5(b) shows the full extent of the spanwise spread for 2000 such Lagrangian trajectories sampled uniformly in the channel. Such wavy structures underlie the irregular dye transport patterns seen in Fig. 1(c). We quantify these deviations from the base flow by calculating the normalized distribution (pdf*) of the ratio between transverse to streamwise cumulative displacements [Fig. 5(c)] defined as δy/δx = Σ|dyi|/Σ|dxi|, where dyi and dxi are particle displacements between frames. The Newtonian data (black) show minimal transverse component and set the measurement noise level. Particles in the viscoelastic fluid, however, exhibit small but finite values of transverse velocity and a broader distribution of individual particle end-to-end displacement. These results indicate the presence of spanwise structures in viscoelastic fluids in parallel shear flows. While these deviations from the base flow are small in absolute terms (2% of the streamwise component), even small deviations in the velocity fields in viscoelastic fluids can represent significant increase in elastic stresses due to the nonlinear relationship between stress and velocity [41,42].
Can these curved particle trajectories drive or maintain flow instabilities far downstream (200 W)? Figure 5(d) shows the distribution of particle path line curvatures at 200 W for Wi = 18, n = 15. The trajectories have a mean curvature of R−1 ≈.023 μm−1, which is an order of magnitude larger than the Newtonian counterpart. Using N1 data (see [34]), we compute the Pakdel-McKinley condition [(λU/R)Wi]1/2 [43]. We find a value of approximately 7, which is sufficiently large to trigger flow instabilities. Similarly, we find that hoop stresses N1/R = 8 Pa/μm are of the same order (or higher) than the viscous drag ΔP/ΔL|n=0 = 2 Pa/μm. Hence additional pressure head is lost to overcome elastic stresses induced by the chaotic flow. These results suggest that weak but nontrivial streamline curvatures generate sufficient elastic stress fluctuations in the secondary flow direction to sustain flow instabilities far downstream.
In summary, we investigated the flow of viscoelastic fluids in a long, straight microchannel at low Re. This flow becomes unstable via a nonlinear subcritical instability at a critical Wi for finite amplitude perturbations [12]. Pressure measurements are used to establish the friction factor scaling for this flow (Fig. 4). We find two regimes: (i) a transitional regime 5 ≲ Wi ≲ 9 in which the (viscous) friction factor fη ~ Wi1/3, and (ii) a turbulentlike regime Wi ≲ 9 in which a sudden reduction of fη is observed followed by a weaker dependence on flow rate. The increase in drag (30%, cf. laminar flow) is accompanied by an increase in pressure fluctuation and development of elastic hoop stresses due to finite spanwise curvature perturbations, which we quantify using high-resolution holographic particle tracking. Unlike the Reynolds stress in classical turbulence, the extra flow resistance here stems from elastic hoop stresses induced by curvature perturbations. Furthermore, the various levels of increased resistance for different polymeric fluid may be controlled by the distribution of such curvatures. At intermediate Re, recent studies on elastoinertial turbulence (EIT) proposed a direct path to the classic drag reduction asymptote, bypassing Newtonian turbulence [44,45]. Whether a common instability underlies these two states, elastic turbulence and EIT, remains an open question. Finally, our results provide strong evidence for the “instability upon an instability” mechanism proposed for the finite amplitude transition of viscoelastic fluids in parallel flows [19] and develop new insights into the flow of polymeric solutions in channels and pipes. Even small perturbations in the velocity field can lead to large changes in elastic stress and flow drag.
Acknowledgments
We thank B. Thomases, A. Morozov, R. Poole, and M. Graham for fruitful discussions. P. E. A. acknowledges support from NSF Grant No. CBET-1336171 and S. D. H. thanks NIST-on-Chip funding.
References
- [1].Larson RG, The Structure and Rheology of Complex Fluids (Oxford University Press, New York, 1999), Vol. 33. [Google Scholar]
- [2].Bird R, Curtiss C, Armstrong R, and Hassager O, Dynamics of Polymeric Liquids: Fluid Mechanics, 2nd ed (John Wiley & Sons, New York, 1987), Vol. 1. [Google Scholar]
- [3].Virk PS, AIChE J 21, 625 (1975). [Google Scholar]
- [4].White CM and Mungal MG, Annu. Rev. Fluid Mech 40, 235 (2008). [Google Scholar]
- [5].Muller S, Larson R, and Shaqfeh E, Rheol. Acta 28, 499 (1989). [Google Scholar]
- [6].Larson RG, Shaqfeh ESG, and Muller SJ, J. Fluid Mech 218, 573 (1990). [Google Scholar]
- [7].McKinley GH, Armstrong RC, and Brown RA, Proc. R. Soc. A 344, 265 (1993). [Google Scholar]
- [8].Groisman A and Steinberg V, Phys. Fluids 10, 2451 (1998). [Google Scholar]
- [9].Arora K, Sureshkumar R, and Khomami B, J. Fluid Mech 108, 209 (2002). [Google Scholar]
- [10].Arratia PE, Thomas CC, Diorio J, and Gollub JP, Phys. Rev. Lett 96, 144502 (2006). [DOI] [PubMed] [Google Scholar]
- [11].Poole RJ, Alves MA, and Oliveira PJ, Phys. Rev. Lett 99, 164503 (2007). [DOI] [PubMed] [Google Scholar]
- [12].Pan L, Morozov A, Wagner C, and Arratia PE, Phys. Rev. Lett 110, 174502 (2013). [DOI] [PubMed] [Google Scholar]
- [13].Groisman A and Steinberg V, New J. Phys 6, 29 (2004). [Google Scholar]
- [14].Groisman A and Steinberg V, Nature (London: ) 405, 53 (2000). [DOI] [PubMed] [Google Scholar]
- [15].Groisman A and Steinberg V, Nature (London: ) 410, 905 (2001). [DOI] [PubMed] [Google Scholar]
- [16].Fardin MA, Lopez D, Croso J, Gregoire G, Cardoso O, McKinley GH, and Lerouge S, Phys. Rev. Lett 104, 178303 (2010). [DOI] [PubMed] [Google Scholar]
- [17].Meulenbroek B, Storm C, Morozov AN, and van Saarloos W, J. Fluid Mech 116, 235 (2004). [Google Scholar]
- [18].Meulenbroek B, Storm C, Bertola V, Wagner C, Bonn D, and van Saarloos W, Phys. Rev. Lett 90, 024502 (2003). [DOI] [PubMed] [Google Scholar]
- [19].Morozov AN and van Saarloos W, Phys. Rev. Lett 95, 024501 (2005). [DOI] [PubMed] [Google Scholar]
- [20].Morozov AN and van Saarloos W, Phys. Rep 447, 112 (2007). [Google Scholar]
- [21].Bonn D, Ingremeau F, Amarouchene Y, and Kellay H, Phys. Rev. E 84, 045301(R) (2011). [DOI] [PubMed] [Google Scholar]
- [22].Qin B and Arratia PE, Phys. Rev. Fluids 2, 083302 (2017). [Google Scholar]
- [23].Wilson HJ, Renardy M, and Renardy Y, J. Fluid Mech 80, 251 (1999). [Google Scholar]
- [24].Bodiguel H, Beaumont J, Machado A, Martinie L, Kellay H, and Colin A, Phys. Rev. Lett 114, 028302 (2015). [DOI] [PubMed] [Google Scholar]
- [25].Poole R, Phys. Rev. Fluids 1, 041301 (2016). [Google Scholar]
- [26].Barlow H, Hemingway E, Clarke A, and Fielding S, J. Fluid Mech 270, 66 (2019). [Google Scholar]
- [27].Morozov A and van Saarloos W, J. Stat. Phys 175, 554 (2019). [Google Scholar]
- [28].Hoda N, Jovanovi MR, and Kumar S, J. Fluid Mech 601, 407 (2008). [Google Scholar]
- [29].Jovanovic MR and Kumar S, Phys. Fluids 22, 023101 (2010). [Google Scholar]
- [30].Jovanovi MR and Kumar S, J. Fluid Mech 166,755 (2011). [Google Scholar]
- [31].Reynolds O, Phil. Trans. R. Soc. London 35, 84 (1883). [Google Scholar]
- [32].Avila K, Moxey D, de Lozar A, Avila M, Barkley D, and Hof B, Science 333, 192 (2011). [DOI] [PubMed] [Google Scholar]
- [33].Pelletier E, Viebke C, Meadows J, and Williams P, Langmuir 19, 559 (2003). [Google Scholar]
- [34].See Supplemental Material at http://link.aps.org/supplemental/10.1103/PhysRevLett.000.000000. for details on rheology and experimental methods, which includes Refs [35,36].
- [35].Pan L and Arratia PE, Microfluid. Nanofluid 14, 885 (2013). [Google Scholar]
- [36].Magda JJ, Lee CS, and Muller SJ, and Larson RG, Macromolecules 26, 1696 (1993). [Google Scholar]
- [37].Moody LF, Trans. ASME 66, 671 (1944). [Google Scholar]
- [38].Jun Y and Steinberg V, Phys. Rev. Lett 102, 124503 (2009). [DOI] [PubMed] [Google Scholar]
- [39].Cheong FC, Krishnatreya BJ, and Grier DG, Opt. Express 18, 13563 (2010). [DOI] [PubMed] [Google Scholar]
- [40].Salipante PF, Little CAE, and Hudson SD, Phys. Rev. Fluids 2, 033302 (2017). [DOI] [PMC free article] [PubMed] [Google Scholar]
- [41].Alves M, Pinho F, and Oliveira P, J. Fluid Mech 97, 207 (2001). [Google Scholar]
- [42].Thomases B, Shelley M, and Thiffeault J, Physica (Amsterdam: ) 240D, 1602 (2011). [Google Scholar]
- [43].Pakdel P and McKinley GH, Phys. Rev. Lett 77, 2459 (1996). [DOI] [PubMed] [Google Scholar]
- [44].Samanta D, Dubief Y, Holzner M, Schafer C, Morozov AN, Wagner C, and Hof B, Proc. Natl. Acad. Sci. U.S.A 110, 10557 (2013). [DOI] [PMC free article] [PubMed] [Google Scholar]
- [45].Choueiri GH, Lopez JM, and Hof B, Phys. Rev. Lett 120, 124501 (2018). [DOI] [PubMed] [Google Scholar]


