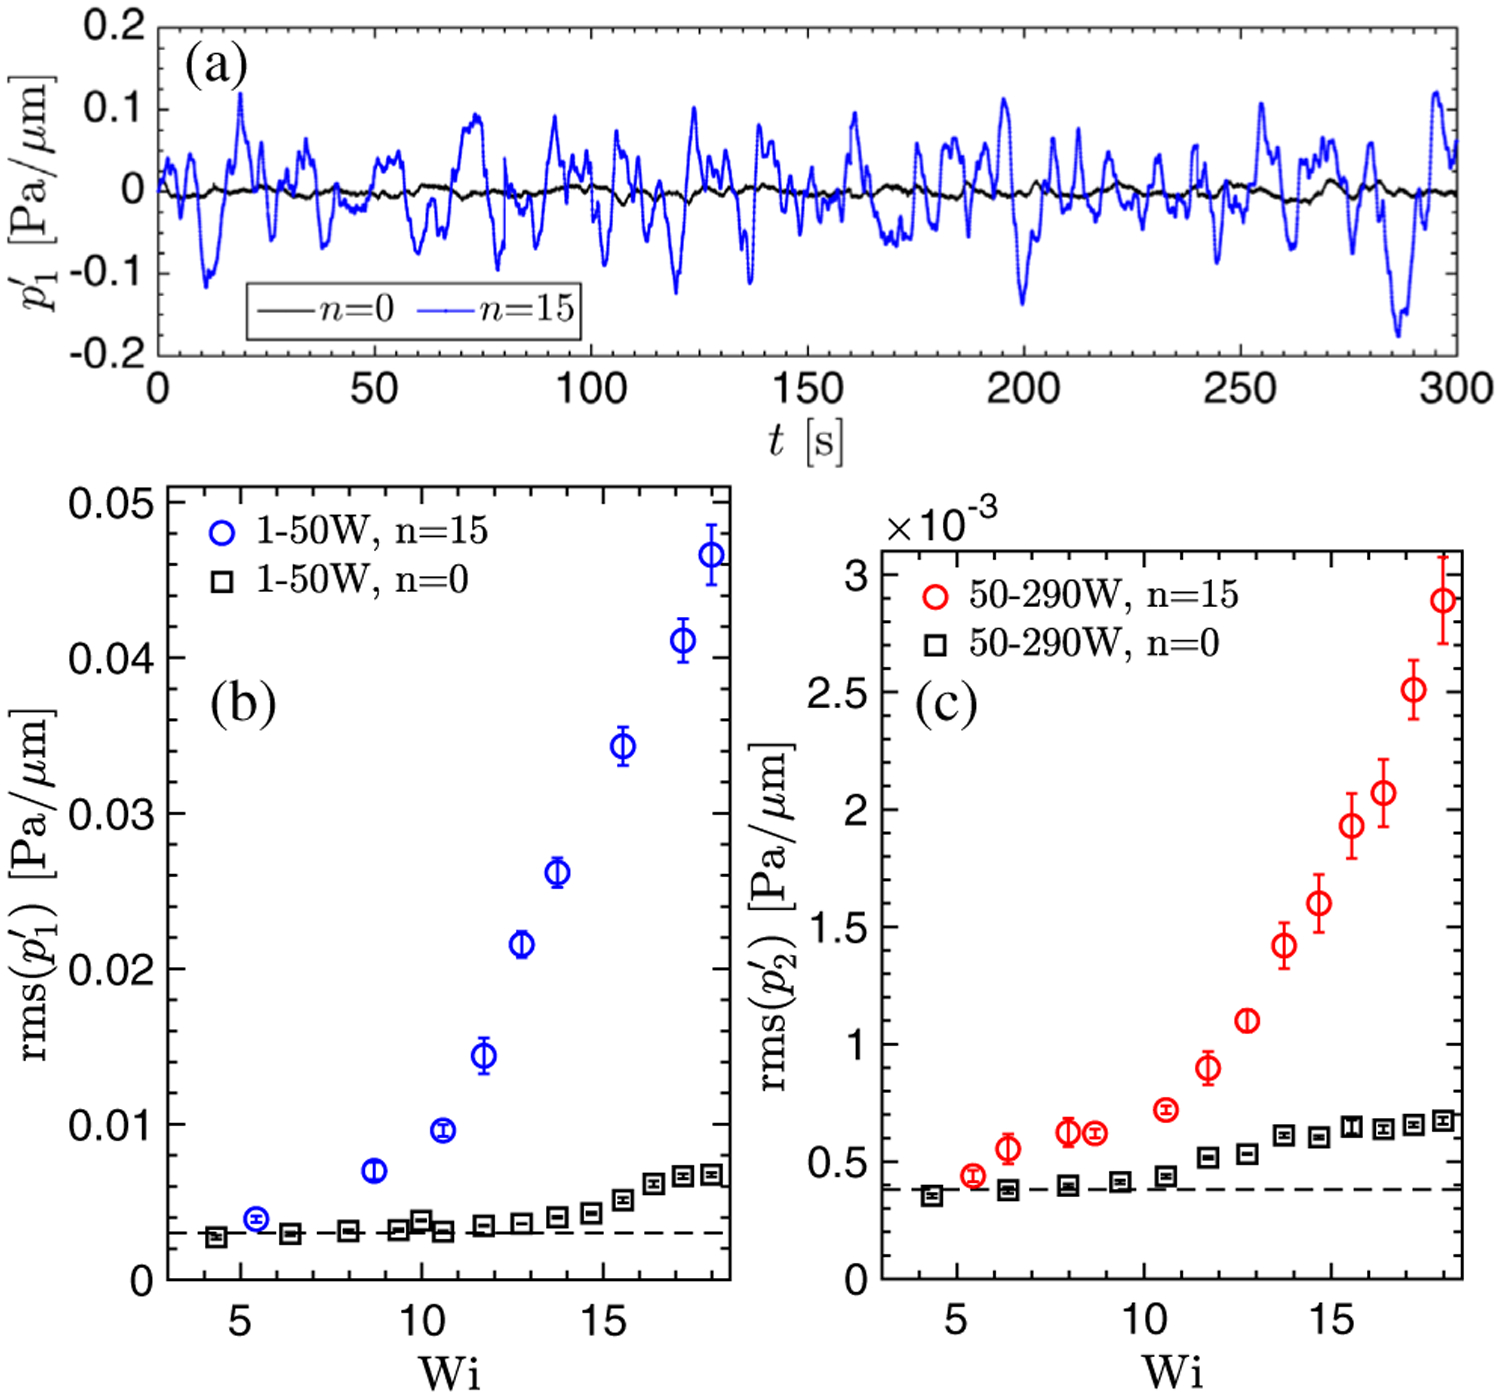
FIG. 3.

(a) Pressure gradient signal p’1(t) for the n = 15 case, compared with the unperturbed n = 0 case, Wi = 18. [(b) and (c)] Root-mean-square (rms) fluctuations versus Wi for n = 0 and 15, (b) p’1, and (c) p’2. The dashed line is the average level for Newtonian fluid, experimentally found to be constant for increasing Q.
