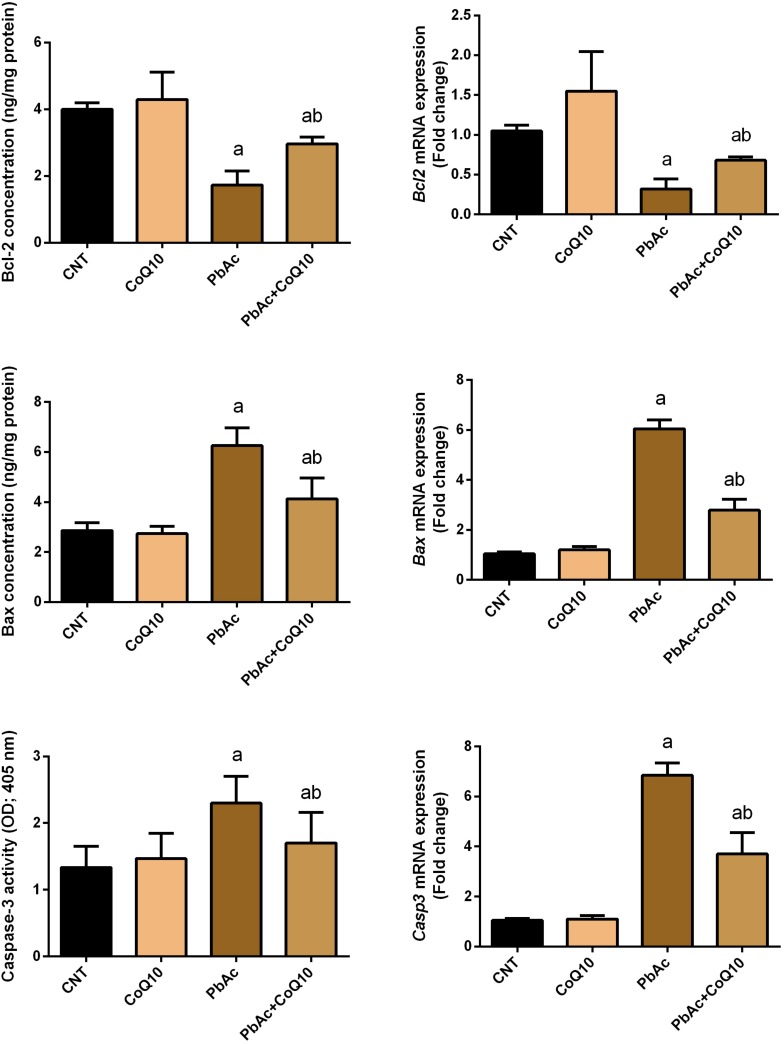
FIGURE 7.
Levels and mRNA expression levels of the apoptotic proteins (Bcl-2, Bax and caspases-3) in the renal tissue following treatment with PbAc (20 mg/kg) and/or CoQ10 (10 mg/kg). ELISA readings are presented as mean ± SD (n = 7). Real-time PCR results are presented as mean ± SEM of triplicate assays and adjusted to Actb. a indicates significant difference vs. the control group at P < 0.05; b indicates significant difference vs. the PbAc treated group at P < 0.05.

